
Table of Contents

How do you know what’s working in your business and what isn’t? Even if you’ve got a pretty good gut feel for the company, how do you know?
Keeping tabs on what’s performing and what’s not isn’t easy, especially in a SaaS business with a thousand moving parts. Budget vs. actual analysis can help you follow what’s going right or wrong more easily so that you can take action.
But what is budget vs. actual, and how can it help you get the most out of your business?
What is Budget vs. Actual Analysis?
Making a budget for your startup is essential because defining the path to your company’s goals is a critical step toward reaching them.
Creating a budget allows you to outline where you want to go. And splitting that budget into months (or quarters, if by month is too granular) lets you see how you’ll get there month by month.
Although building a solid budget isn’t easy, it’s only half the job. The other half of the equation is execution. And execution can be hard.
To help you along the way, you need an assortment of variance analyses. One of the most important is budget vs. actual.
Components of budget vs. actual
Budget vs. actual compares how the company performs (the actuals) with the defined target (the budget) over fixed periods.
Getting actionable information from your analysis requires comparing the actual figures against the budget figures with enough granularity to be useful for decision making. You can start with the significant blocks like:
-
Revenue
-
Material or cost of revenue (for SaaS, this includes customer service and hosting)
-
Gross profit
-
Gross margin (in %)
-
Other expense categories applicable to your company (i.e., marketing, general and administrative costs, R&D)
-
Net income
For further details, link your financial figures to non-financial metrics that serve as the building blocks for your revenue, i.e., CRM metrics like churn and conversion rates. Adding these can provide even more insight into where the company is not performing as it should.
Significant gaps should be analyzed in terms of absolute values and percentages. For example, a 25% gap is enormous but doesn’t have the same impact on a $100 line as it would on a $500k line. Focus on high magnitude gaps first, then move to lower value deviations.
Why is budget vs. actual analysis critical?
With the budget (or a forecast), you’ve defined a baseline against which you can measure your actual performance.
The analysis serves two primary purposes:
-
Shows company leadership that the company is on or off track.
-
Highlights areas that require additional focus.

Use Variance Analysis to Drive Outcomes
The company’s reporting system must be robust enough to help the management team look at the big picture AND drill down into the details.
Areas that need focus are generally those with the most significant variations, either on their own or in comparison with other metrics. For example, if your cost of revenue increases 20% vs. budget, but so does your annual recurring revenue (ARR), the expected link between the two indicates little cause for concern.
On the other hand, if your revenue increases by 5% but your sales and marketing balloons by 50%, that’s cause for investigation.
This methodology applies to financial and other metrics, like conversions, leads, and top-of-funnel metrics. The key is to first set the baseline for each set of metrics, either in a budget or a forecast.
The outcome of the variance analysis can then determine necessary actions and next steps. The initial action might simply be to procure additional information.
For example, based on your funnel metrics (i.e., higher traffic, increasing PPC costs), monthly recurring revenue (MRR) should be increasing. But despite those increases, MRR is stable. The first step might be to investigate what’s happening:
-
Are you targeting the wrong audience or a demographic not in a position to subscribe?
-
Or is your copy not converting for some reason?
It might take a few weeks, or even months, of testing and tweaking to get to the bottom of the issues. But without the variance analysis, knowing where to start could be impossible.

How to Analyze Budget vs. Actuals for a SaaS Company
Mathematically, variance analysis is quite simple; it’s just a little subtraction and maybe some percentages.
However, your assessment of those differences can bring massive value. Start by looking at absolute differences, but don’t forget the importance of percentages.
One essential aspect of meaningful analysis is building a budget baseline with the same structure as your actual reporting. This is simple in a system like Forecast+, while manual reporting can be a real challenge. Manually mapping accounts to P&L lines can be time-consuming and lead to errors.
An example using Forecast+
Let’s see what happened in an example company from January to July 2019.
Above Gross Margin
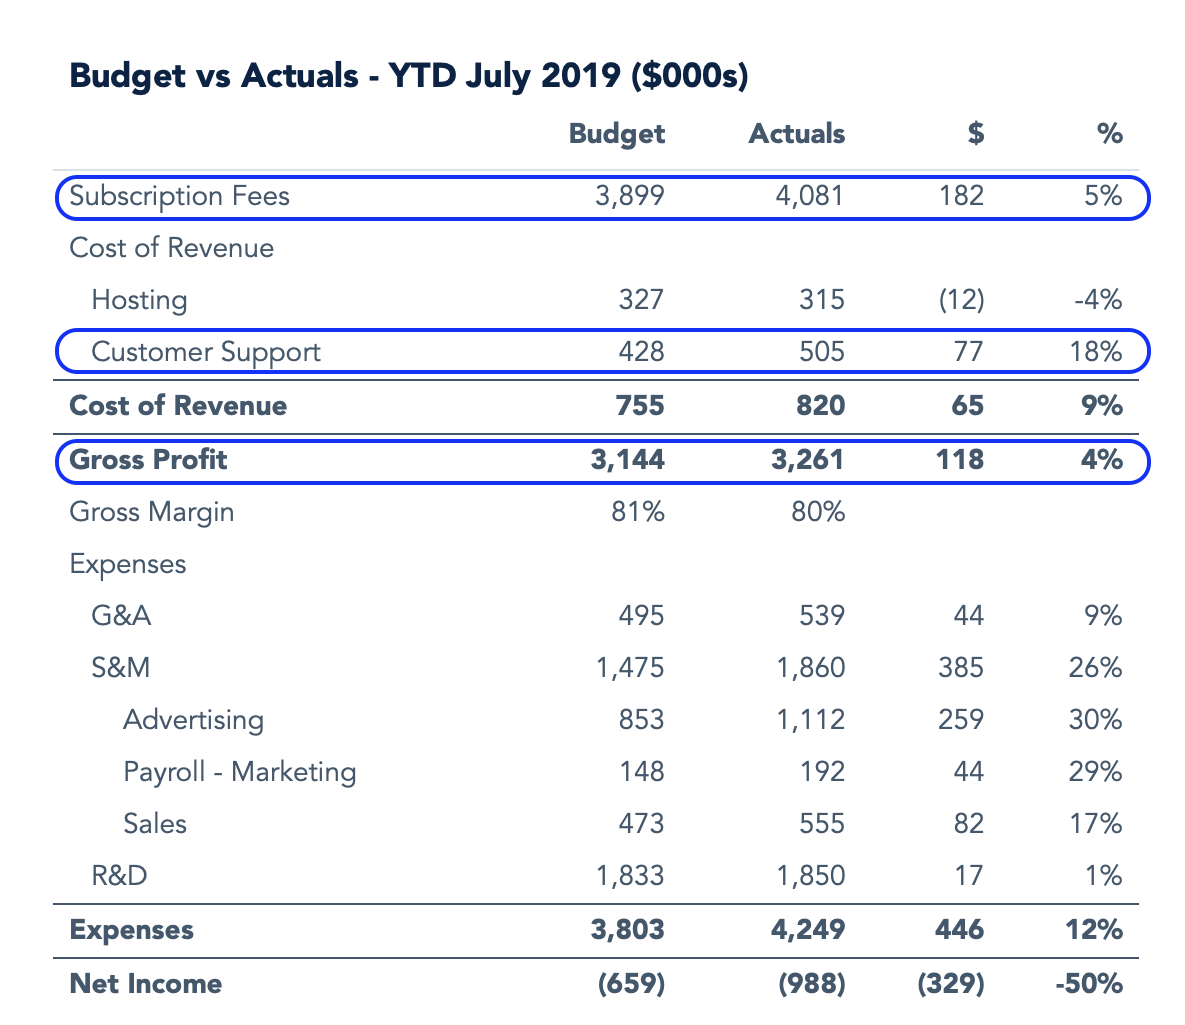
First up, look at the top-line revenue. We budgeted $3.9 million in sales and ended the year with $4.08 million. It’s not a massive overshoot, but a material improvement nonetheless.
However, scrolling a bit further, we see that it’s not only revenue that ended up higher than budget. Cost of revenue is also up 9% vs. plan, while sales are only up 5%.
Unfortunately, we’re spending too much on customer support compared to our initial expectations.
Either we underestimated our cost of revenue, or something isn’t under control. Several issues could drive this deviation:
-
Perhaps the customer onboarding experience isn’t as smooth as it should be.
-
Maybe our staff hasn’t been efficiently solving customer problems. Can we train them better? Eliminate low-performing reps? Provide better standard operating procedures (SOPs)?
Whatever the reason, this deviation is significant enough to warrant further investigation.

Overall, gross profit is up by $118k (+4%), but the gross margin is down 1% vs. budget. Not bad, but not great either. Because of the higher level of support, we couldn’t convert all the additional revenue to margin.
Expenses and Profit
Next, let’s look at the rest of our expenses and how they impact the bottom line.

2019 G&A (general and administrative expenses) were roughly 9% or 44k above budget. While this isn’t an outstanding performance, it’s not a significant driver of our deviation vs. budget.
The same is valid for R&D (I’m purposefully skipping S&M for now). At +1% vs. budget it’s only a minor deviation and we seem to have more significant problems.
“Houston, we have a problem.”
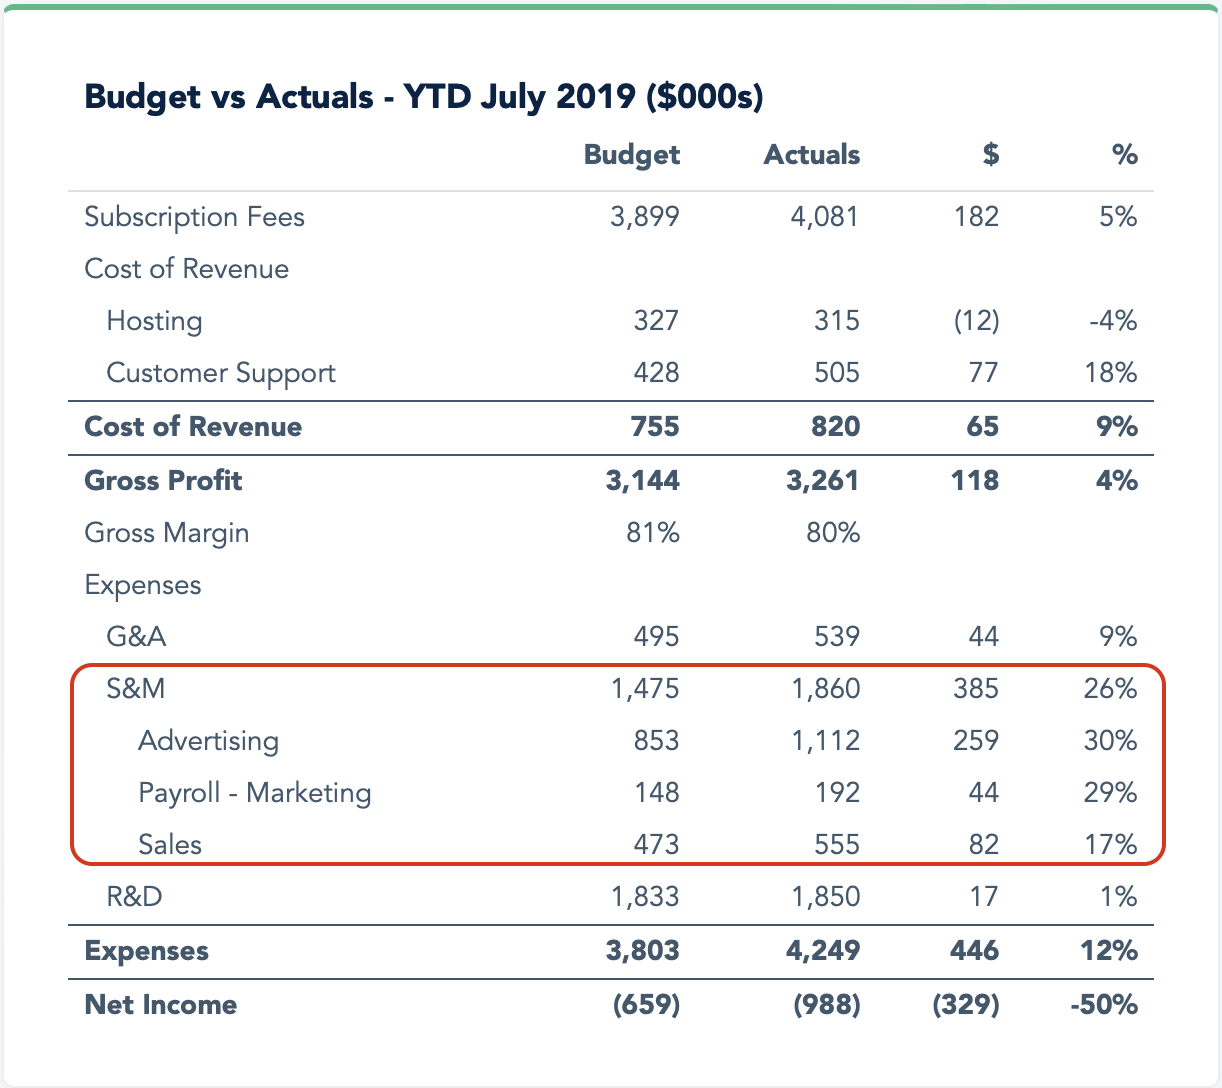
We have some significant gaps in sales and marketing (S&M), and missing the mark by $385k (26%) is massive compared to our other gaps. Determining the root causes here is where we’ll need to spend most of our time.
Looking through the S&M subcategories, we spent 30% more on both advertising and payroll-marketing than planned.
The big question to answer will be: Why did we spend so much more on S&M for so little return?
The ratio isn’t visible in the view, but the return on S&M spend is actually below 0.5:1, meaning every additional dollar spent on sales and marketing generated only $0.50 in revenue.
Perhaps this is a little oversimplified, but the issue is clear: We’re not converting additional sales to additional net income.
Overall, driven mainly by our gap in S&M, our expenses were nearly half a million over plan. Combined with our slightly higher gross profit, we lost an additional $329k vs. budget.
Key takeaways from our analysis
As a SaaS company, revenue and marketing are often the central levers for profitability. Once your product and development team is stable, more sales generally equal more profitability, and the caveat is that you can’t spend too much generating those sales.
Keep in mind that the analysis isn’t only for research. Use this information to drive action to reassess our forecast and address the root cause of our overspending.

Growing SaaS Companies Use Forecast+
When building a business, speed is essential. Quickly recognizing that you’re missing your targets allows rapid corrections to try something new.
Dedicated tools like Forecast+ allow for quick and easy creation of these variance analyses. The ability to drill down from high-level gaps to pinpoint exact areas of concern makes improvements easier. A flexible dashboard means you can update what you track as you learn what areas of your business need more attention.
Further integration with accounting systems like QuickBooks or Xero lets you automatically import data, create accurate and flexible forecasts, and make your variance analysis a breeze.
Variance analysis is the fundamental link between the founding team’s vision and what’s happening in the real world. Data and systems are critical to providing this reporting rapidly. Time spent compiling data and building spreadsheets to compare your actual vs. budget doesn’t add value.
With Forecast+, Baremetrics gives you the tools to perform rapid and meaningful budget vs. actual variance analysis for your growing SaaS business. These flexible financial planning tools let you prepare for what the future brings, no matter what.
When you’re ready to get all of your business’s metrics and analysis in one place, import your financial and CRM data into Forecast+ and book a free consultation with our SaaS experts at Baremetrics.
