
Table of Contents

Ask your revenue data a question
The Baremetrics MCP lets you ask Claude about your MRR, churn and customers in plain English, and get answers pulled from your real Baremetrics data.
MCP stands for Model Context Protocol. It's an open standard that lets AI assistants connect to tools and data outside the chat. Once you connect Baremetrics, Claude can look up your metrics, plans, customers and charges instead of guessing.
The MCP allows agents to only view your data. Every MCP endpoint is read-only, so Claude can't change a plan, cancel a subscription or edit a customer record.
I work on content at Baremetrics, so I came to the MCP the way most customers will: connecting it for the first time and working out what to ask. Before writing this guide, I ran every prompt in it against a live Baremetrics account and checked the answers against the dashboard. To protect customer privacy, customer names in the screenshots have been changed and sensitive details are blocked out.
All 15 returned a useful answer. One needed a follow-up to get it into a shareable format, and two ran into quiet weeks with little to report.
The 15 prompts below are organized around jobs you already do: a weekly metrics check, an investor update, a churn investigation, or a pricing review. Where a prompt needed tweaking, I've included the version that worked and noted what changed.
What surprised me most was how often Claude questioned its own answers. It flagged two totals that didn't match, marked a guess it hadn't verified, and noticed when a metric's monthly numbers didn't add up. When I asked it to go back over its answers, it also caught and corrected its own mistakes.
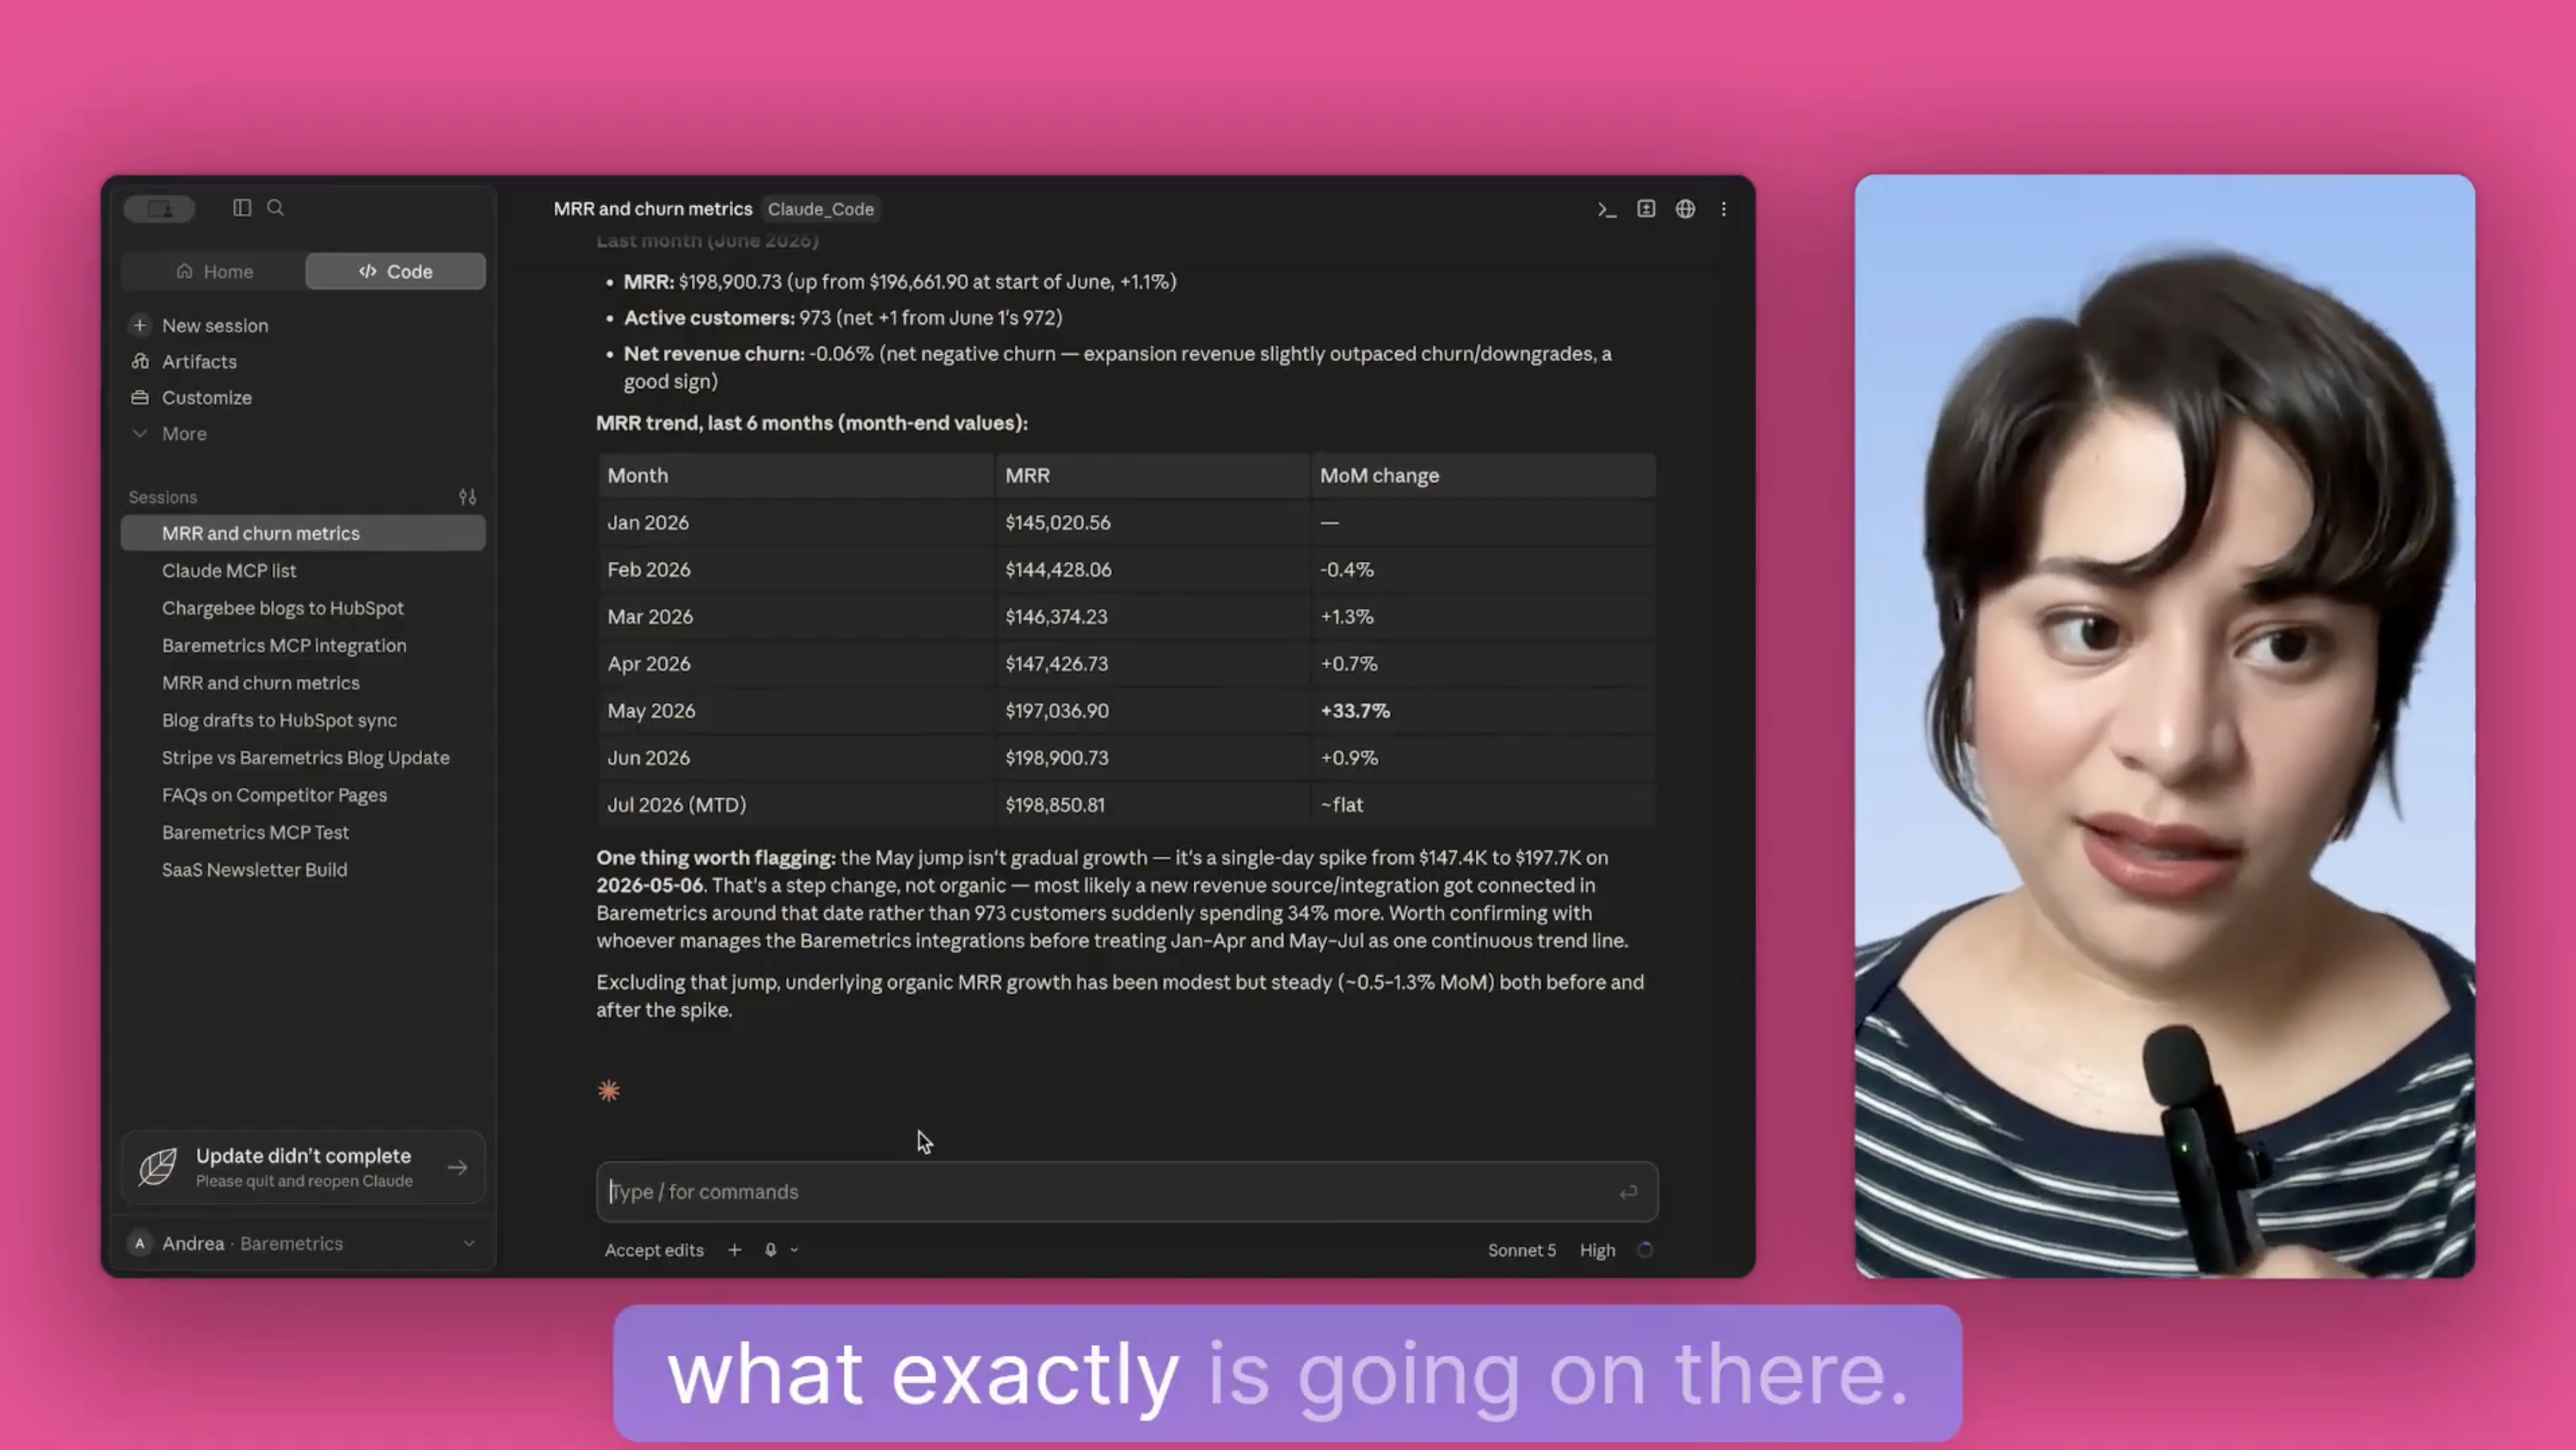
It isn't perfect. Claude reads raw data and interprets it, and it can get details wrong. When I asked for an investor update, the draft stated a guess about billing timing as fact. Claude only flagged it as unverified in a note underneath.
Where it shines is spotting trends and pointing you to the right question. Before a specific number goes into a board deck, check it against your Baremetrics dashboard. The tips at the end cover what I learned about avoiding those mistakes.
What the Baremetrics MCP can and can't do
The MCP gives Claude read access to the core of your Baremetrics account: metrics, customers, subscriptions, plans, and charges. If you've connected Intercom to Baremetrics, Claude can also see support metrics, such as median time to first reply.
| Area | What Claude can look up |
| Metrics | Daily values for 21 metrics, including MRR, ARR, ARPU, LTV, user and revenue churn, trial conversions and failed charges, with period comparisons |
| Metric breakdowns | The customers behind a metric (who cancelled, who upgraded) and any metric split by pricing plan |
| Cohorts | Monthly retention cohorts by signup month |
| Customers | Search by name, email or ID; LTV, plans, status, notes and event history (the most recent 100 events), including recovery emails and cancellation reasons |
| Subscriptions and plans | Status, plan, start date, MRR and cancellation date; plan pricing, interval and trial length |
| Charges and events | Charges by date, customer or subscription with status, plus an account-wide activity feed |
A few things are outside its reach today:
- It can't change anything. There are no write actions.
- Some features are only partly available. Forecast, Benchmarks, and segments aren't available through the MCP. The Recover and Cancellation Insights reports aren't either, but each customer's event history includes recovery emails and cancellation reasons, so Claude can see them one customer at a time.
- Some views take a longer route. The quick "who's behind this metric" lookup doesn't cover MRR, active customers, or active subscriptions. Claude can still build that view from your subscription list, which includes each subscription's MRR, but on a large account it takes more requests. To see who drove MRR growth, asking about new customers, upgrades and reactivations is faster.
If you ask Claude to forecast or benchmark anyway, it may estimate from the data it has. Treat any answer like that as an AI estimate, not a Baremetrics Forecast.
Getting connected
The Baremetrics MCP works with desktop AI tools: Claude Desktop, Claude Code, Cursor and Codex.
Browser-based clients, including Claude.ai on the web and ChatGPT, aren't supported yet. They require OAuth sign-in, which is on the way. For now, use a desktop app.
You'll need two things:
- A Baremetrics account. A free trial works.
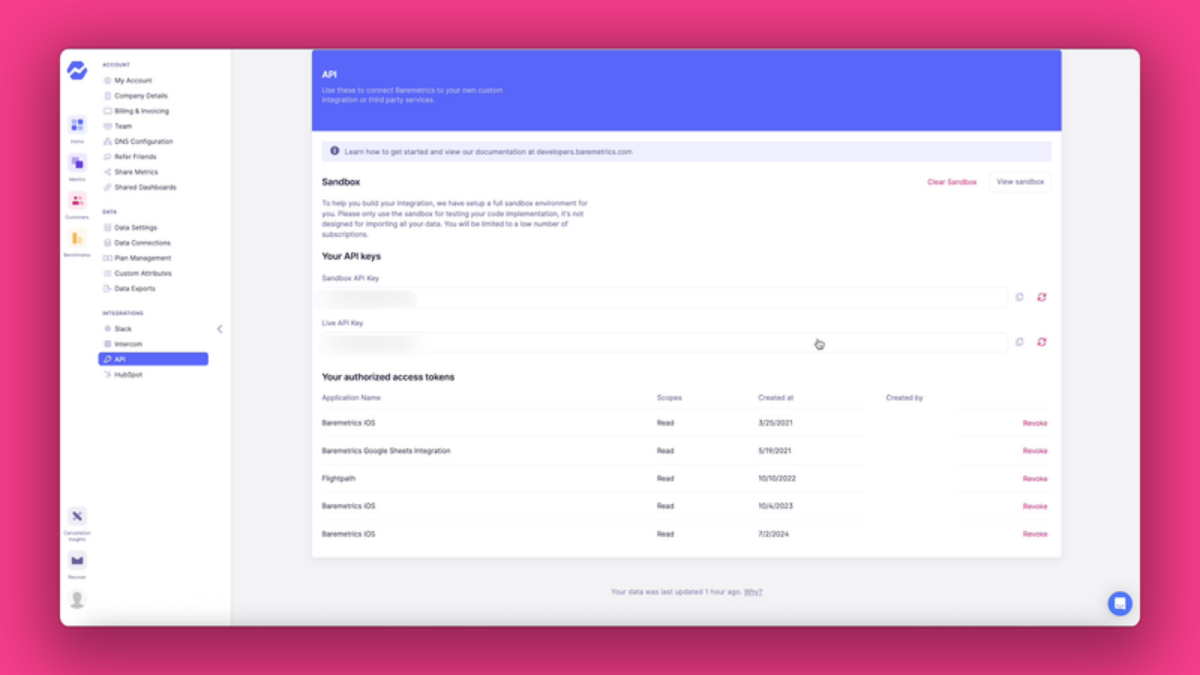
- Your live API key from Settings → API in Baremetrics. It starts with
lk_.
The quickest route is Claude Code. Run this once in your terminal, swapping in your key:
claude mcp add baremetrics https://app.baremetrics.com/mcp \
  --transport http \
  --scope user \
  --header "Authorization: Bearer <BM_API_KEY>"
For Claude Desktop, Cursor, Codex and other clients, follow the step-by-step config in our help article.
Treat your API key like a password. Don't paste it into a chat or share config files that contain it.
A quick check that everything's connected
Start with a question you already know the answer to. If Claude gets it right, the connection works and it's reading the right account.
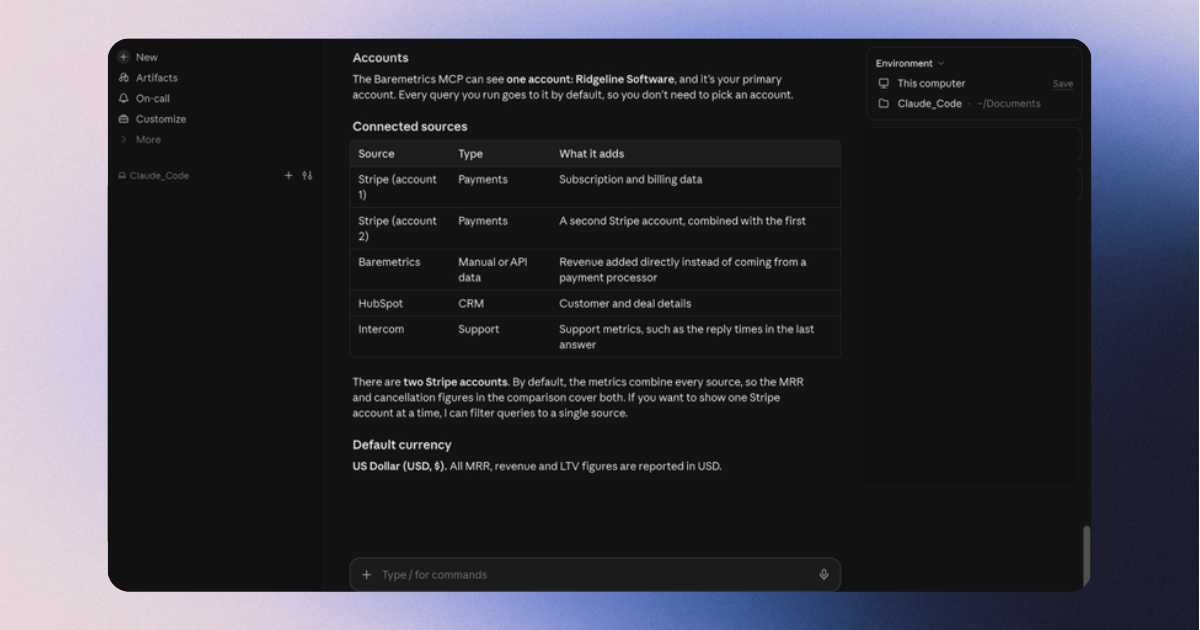
Using the Baremetrics MCP, which Baremetrics accounts and payment sources can you see? What's the default currency on my primary account?
Claude will list the accounts you can access, your connected payment sources (Stripe, Braintree and so on) and your currency. If you manage more than one Baremetrics account, this is also how you find out which one Claude is reading by default. Name the account in later prompts if it's not the primary one.
In the account I tested, Claude found five sources: two Stripe accounts, revenue added manually in Baremetrics, HubSpot and Intercom. It also pointed out that metrics combine every source by default. If you only want one Stripe account, say so in your prompt.
Your weekly metrics check
These three prompts replace the Monday-morning click-through of your dashboard with a short written summary.
1. Compare this week with last week
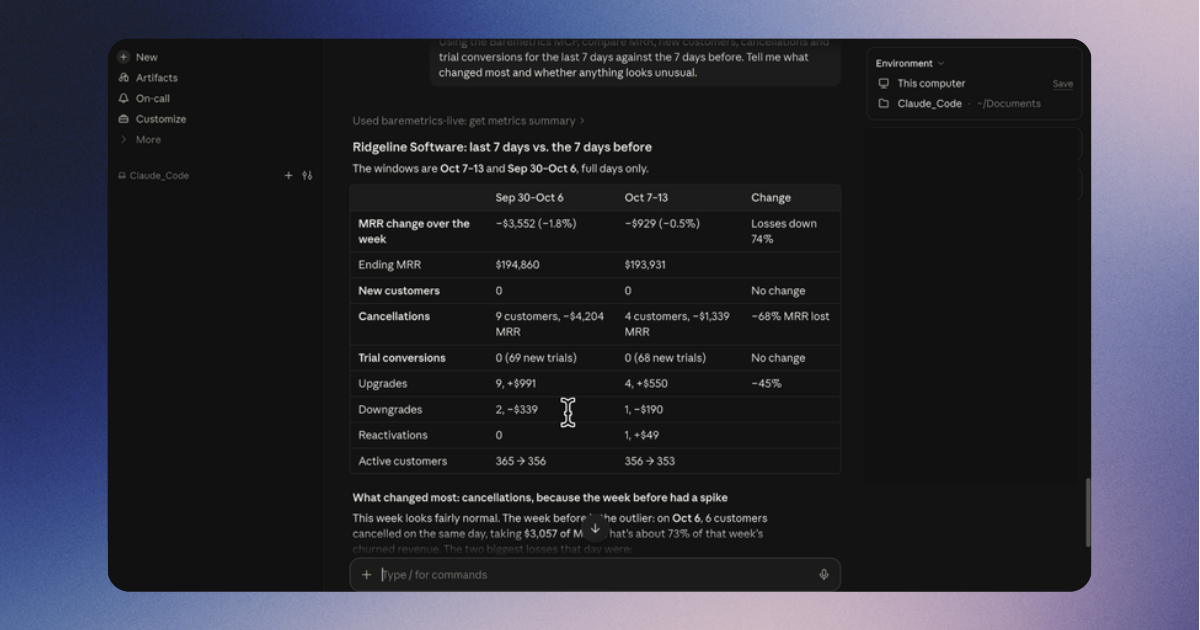
Using the Baremetrics MCP, compare MRR, new customers, cancellations and trial conversions for the last 7 days against the 7 days before. Tell me what changed most and whether anything looks unusual.
Claude pulls daily values for each metric and summarizes the movement. The useful part is the commentary: a spike in cancellations on a single day, or trial conversions dropping while signups hold steady.
When I ran this, Claude went beyond the totals. It traced a jump in lost MRR back to a single day with several cancellations, and pointed out that some were annual plans that may simply not have renewed. It also flagged a metric that looked wrong and suggested checking the tracking before treating it as a business problem.
2. Decide which failed payments to chase first
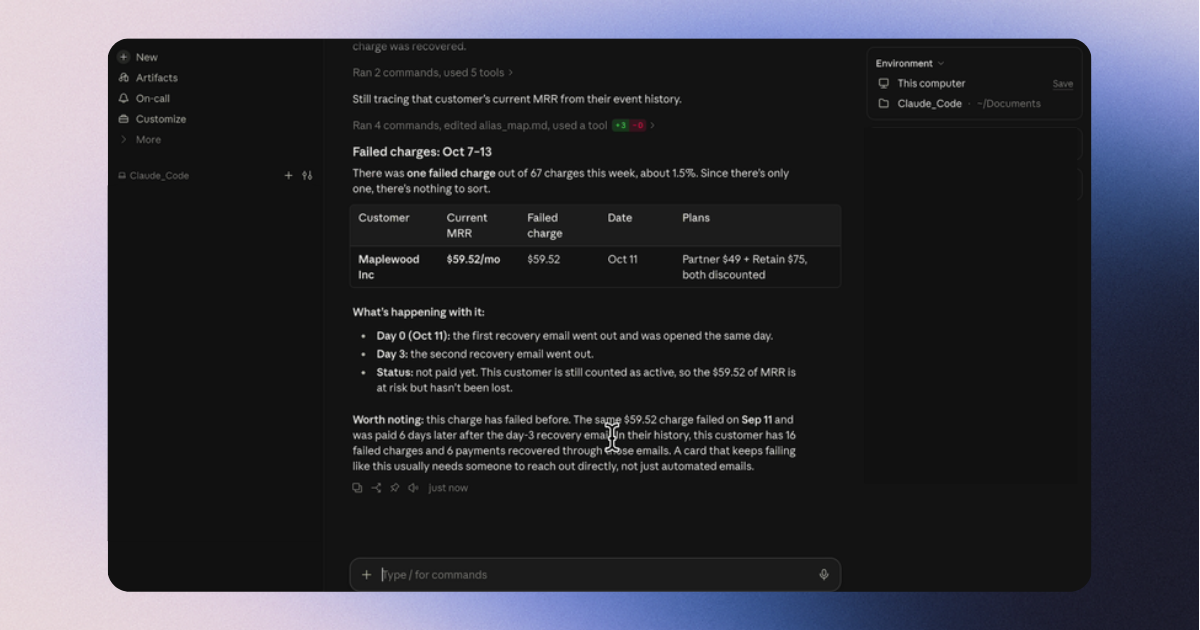
Using the Baremetrics MCP, list every failed charge from the last 7 days. For each one, show the customer and their current MRR, sorted from highest MRR to lowest.
Not every failed payment is worth the same effort. This puts your biggest accounts at the top so you can reach out to them personally.
The week I tested had only one failed charge, so there was nothing to rank. Claude still went further than I asked. It traced the customer's history, found the same charge had failed a month earlier, and found a long run of failed payments before that. Its suggestion: a card that fails this often needs a personal follow-up, not just automated emails.
3. Catch up on yesterday
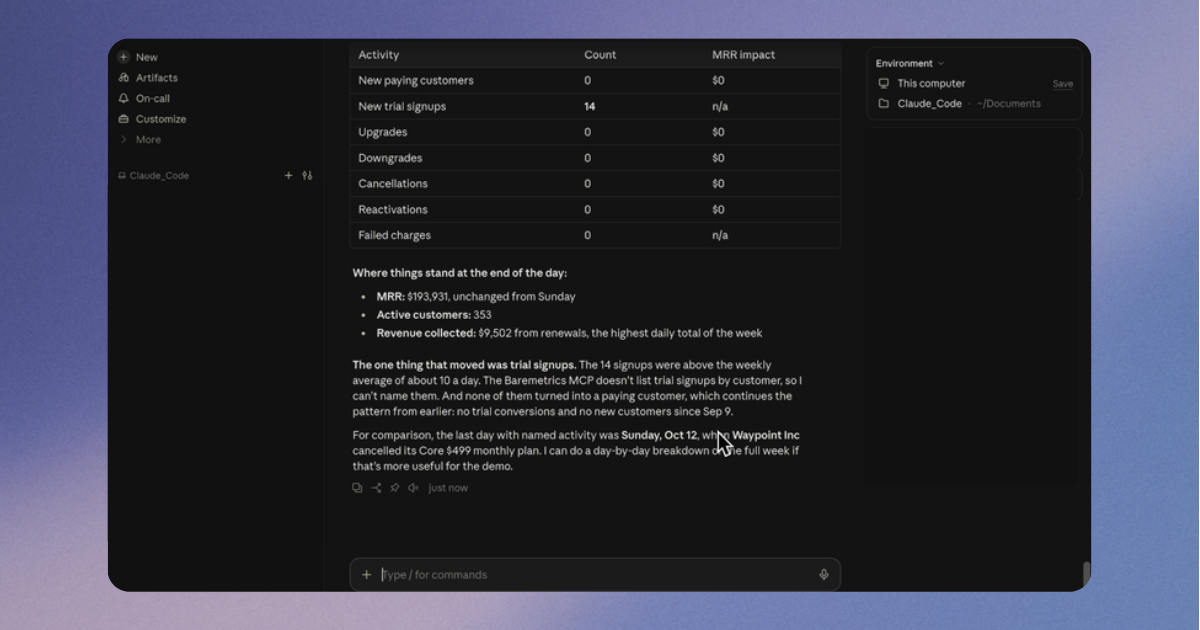
Using the Baremetrics MCP, summarize everything that happened in my account yesterday: new signups, upgrades, downgrades and cancellations. Name the customers involved.
This reads your account's activity feed and turns it into a short recap. It's useful after a day away or as a daily note to your team.
My test day was quiet, so Claude had no customers to name. It said so plainly, explained that the MCP can't list trial signups by customer, and offered a day-by-day breakdown of the week instead.
Writing the monthly investor update
The investor update is mostly the same numbers in a new month. Let Claude gather them and write a first draft, then edit it in your own voice after validating the numbers in Baremetrics.
When I sat down with Luke Marshall, our CEO, to run a monthly checkup with the Baremetrics MCP, he explained why he likes working this way:
"This is why I like it as an analyst. I can talk to it in a more conversational tone, and it lets me follow my train of thought instead of having to stop and think, 'Where do I go to find that data point?'" — Luke Marshall, CEO of Baremetrics
You can watch the full session in We Ran a Monthly SaaS Metrics Audit with Claude. Luke starts with last month's downgrades, follows up on expansion, and works his way to net revenue retention, all in one conversation.
4. Draft the update from last month's numbers
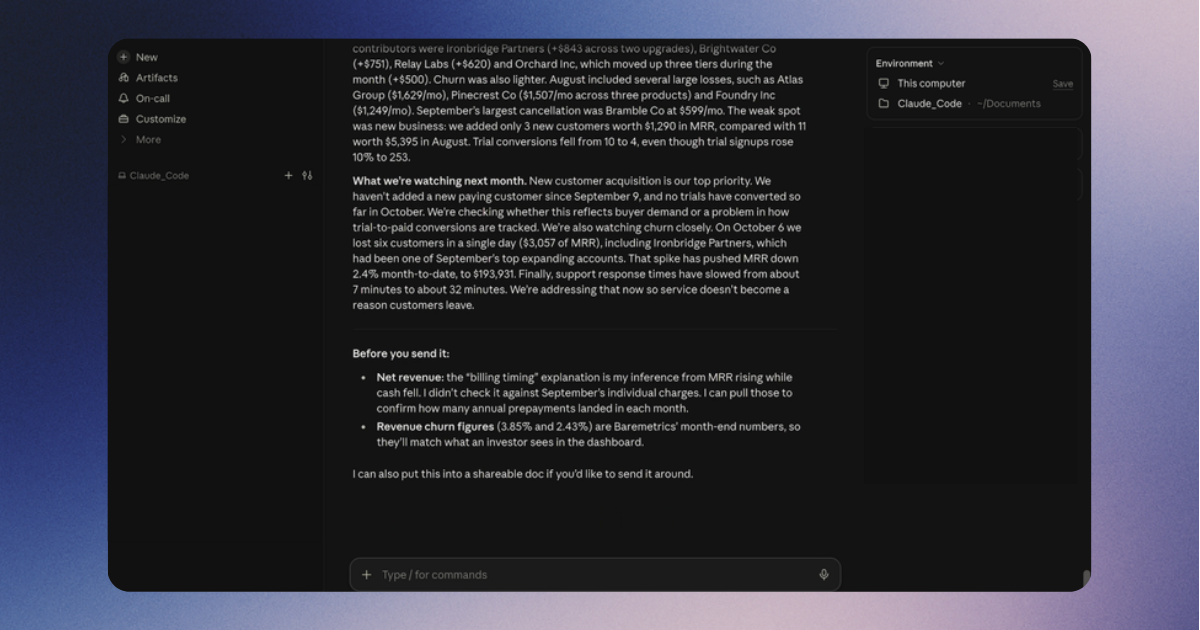
Using the Baremetrics MCP, pull last month's MRR, net revenue, revenue churn and new customers, and compare each with the month before. Then draft a three-paragraph investor update: headline numbers, what drove the change, and what we're watching next month.
Claude will fill the "what drove the change" paragraph with its own reading of the data. Rewrite it with what you actually know about the month. Check every number against your dashboard before you hit send.
When I ran this, the draft was solid, but one line stood out. It said a dip in net revenue was down to billing timing. Underneath the draft, Claude flagged that this was its own inference from MRR rising while cash fell, and that it hadn't checked the charges. That's exactly the kind of sentence to verify or cut before you send.
5. See who expanded
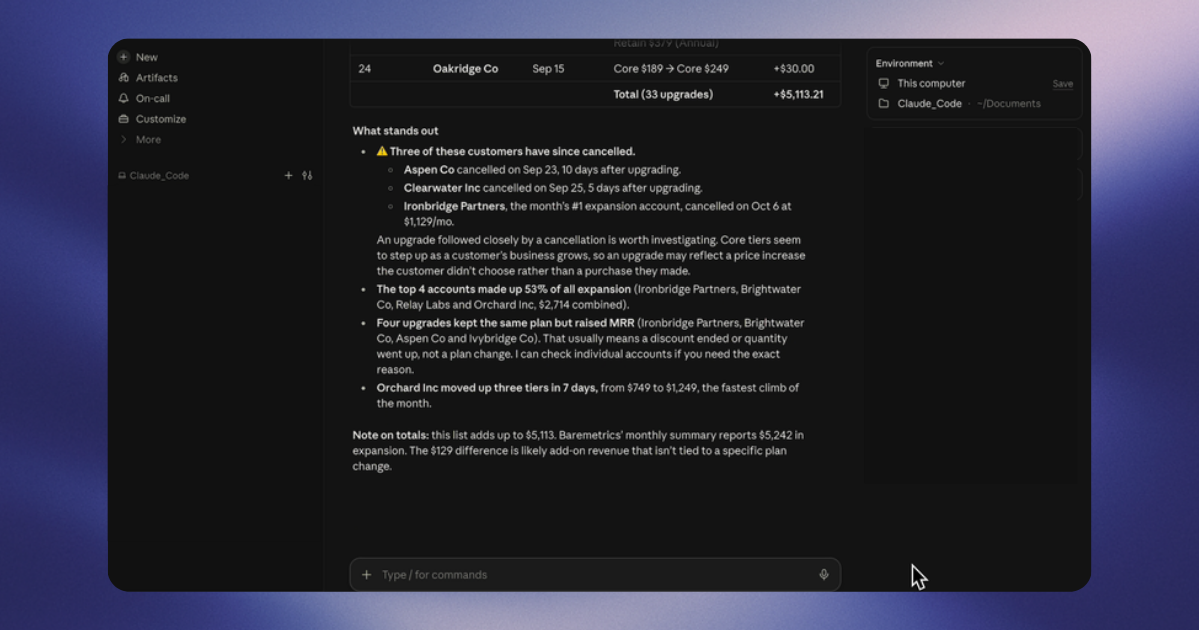
Using the Baremetrics MCP, list the customers who upgraded last month, with the plan they moved from and to and how much MRR each added.
Investors like to see expansion, and this gives you named examples. It also works for new customers and reactivations if you want the full picture of what grew MRR.
When I ran this, Claude listed every upgrade with the MRR it added and grouped customers who upgraded more than once. It also cross-checked the list against later cancellations and flagged customers who left soon after upgrading, a warning sign worth catching early.
Investigating a churn spike
When churn jumps, the first questions are always who left, what they were paying, and what happened before they went. These prompts work best in sequence, in one conversation.
6. Find out who cancelled
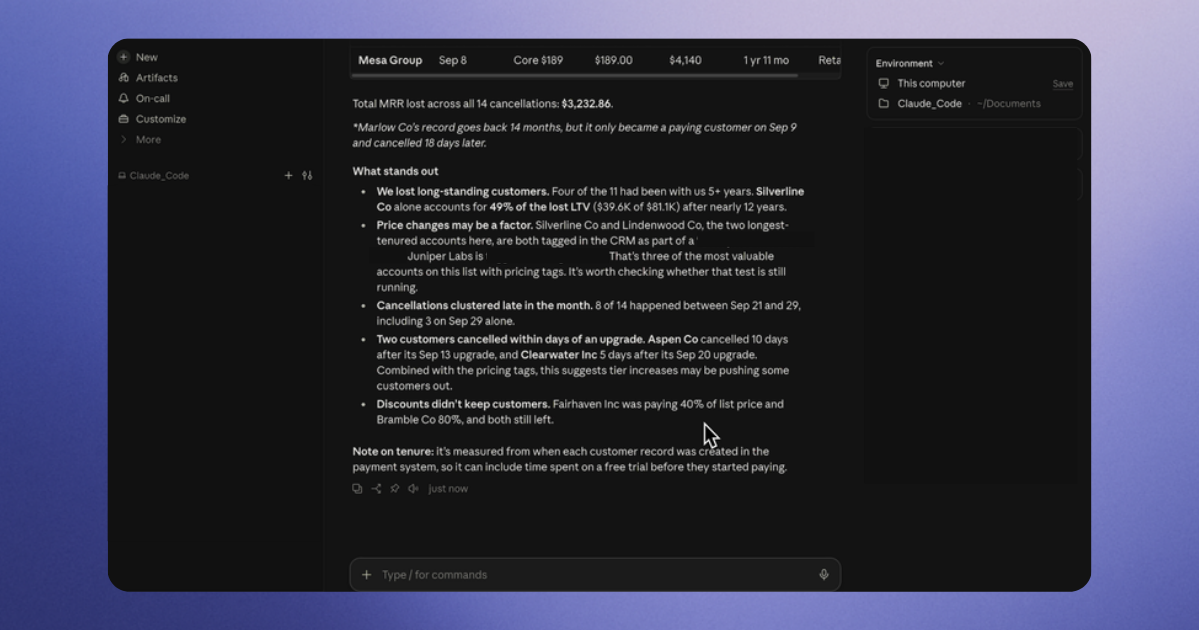
Using the Baremetrics MCP, user churn went up last month. List the customers who cancelled, the plan each was on, their LTV, and how long they'd been customers.
Look for patterns: cancellations clustered on one plan, a run of customers who left in their first 90 days, or one large account skewing the rate.
When I ran this, Claude separated customers who left entirely from those who dropped one product but kept paying for another. It sorted both lists by LTV, which put the longest-standing losses at the top. It also read the tags stored on each customer's Baremetrics record, which added context the billing data alone didn't have.
7. Read the history behind the biggest losses
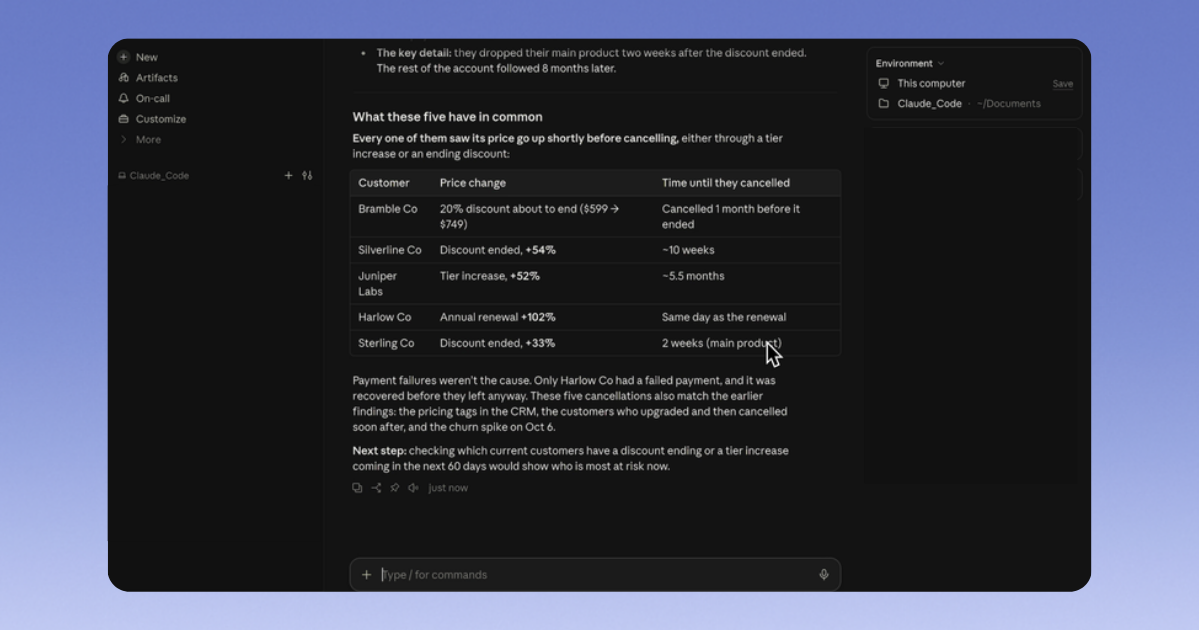
For the five largest cancellations from that list, walk me through each customer's history before they left: plan changes, failed payments, refunds and any notes on their record.
This is where the MCP saves the most time. Instead of opening five customer pages, you get each story side by side. A downgrade two months before cancelling, or a string of failed charges, tells you a lot about whether the churn was preventable.
This was the most useful prompt in my testing. Claude built a timeline for each customer, and a pattern jumped out: all five had seen their price go up shortly before cancelling, through either a tier increase or an ending discount. That would have been hard to spot one customer page at a time. It also explained a tie-break when three customers had the same MRR, and flagged that very long histories get cut off.
8. Check whether one plan is losing more than the rest
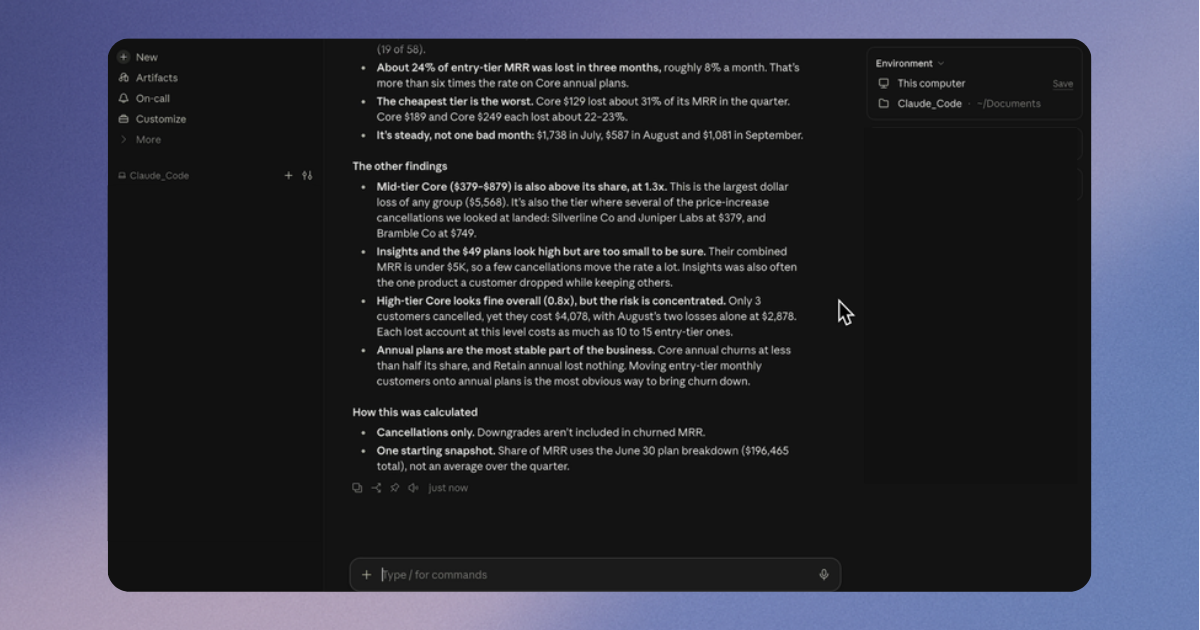
Using the Baremetrics MCP, break down revenue churn by plan for the last three months. Is any plan churning out of proportion to its share of MRR?
If one plan is losing customers faster than the others, that's a pricing or packaging question, not just a retention one.
The account I tested has dozens of price tiers, so Claude grouped them by product and price level before comparing. It then showed which groups were losing revenue out of proportion to their size. It also listed exactly how it calculated the numbers, which made the result easy to check.
Reviewing your pricing and plans
Pricing decisions need a clear view of how each plan actually performs. These prompts give you that before a pricing review.
9. See your whole plan lineup at once
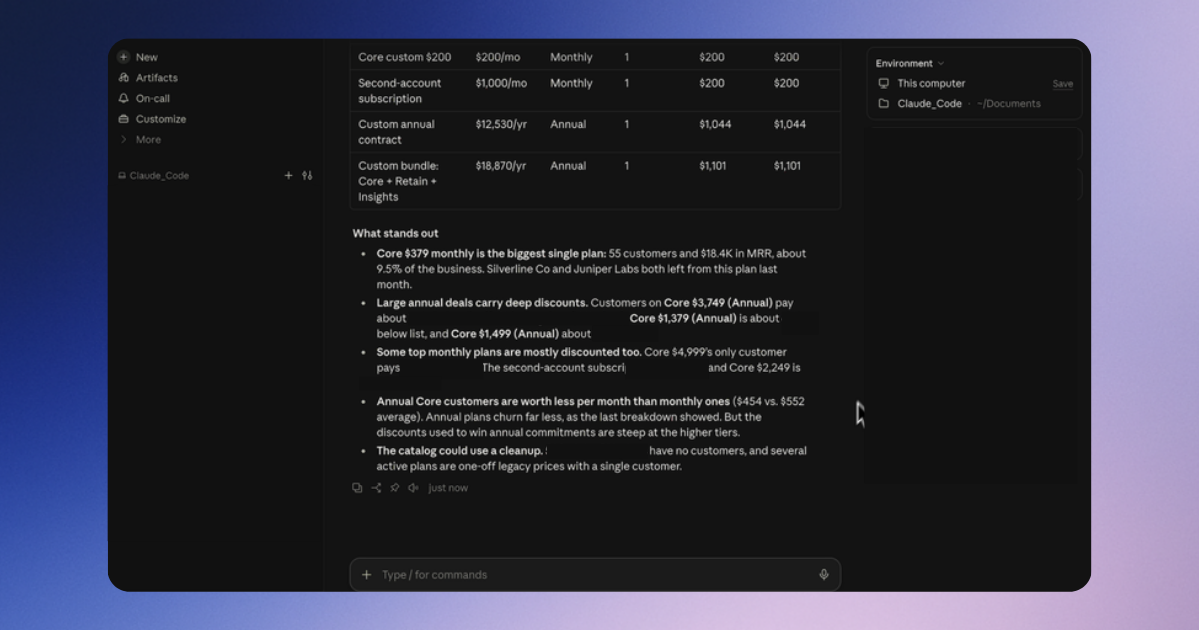
Using the Baremetrics MCP, list all active plans with their price, billing interval and trial length. For each, show ARPU and the number of active customers.
Old plans tend to pile up. This shows which ones still carry customers and which could be retired.
Claude separated plans with paying customers from older plans with none. It checked that the plan-level MRR added up to the account total, and it did, exactly. It also solved a puzzle from my first prompt: one free trial plan had no end date, which explained an oddly high trial count.
10. Map where customers move between plans
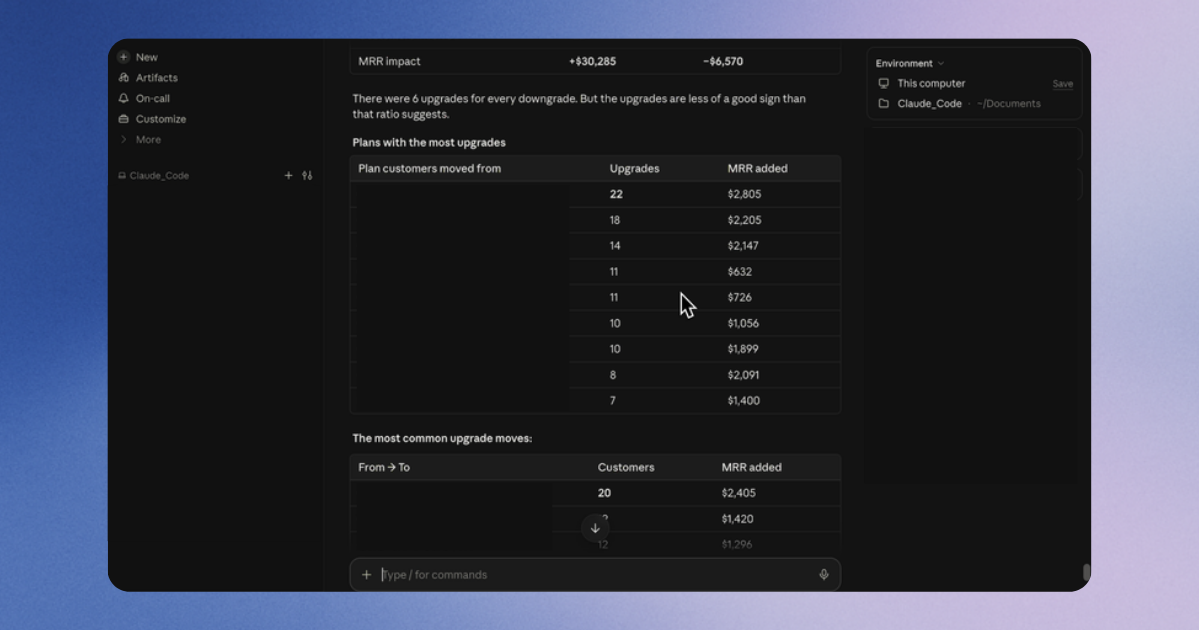
Using the Baremetrics MCP, for the last six months, which plans see the most upgrades and which see the most downgrades? Where are customers moving from and to?
A common upgrade path tells you which plan is doing its job as a stepping stone. A common downgrade path can point to a plan that's priced too high for what it includes.
When I ran this, Claude didn't take the upgrade and downgrade labels at face value. It separated real plan changes from price changes on the same plan, like a discount ending (counted as an upgrade) or a discount added to keep a customer (counted as a downgrade). It also noticed when plan changes clustered on the same few days, which usually means a pricing change rather than customer choice.
11. Find out what discounts are costing you
Using the Baremetrics MCP, which active subscriptions currently have a discount, and how much are we discounting per month in total?
Discounts that start as one-off deals have a way of becoming permanent. This puts a number on it.
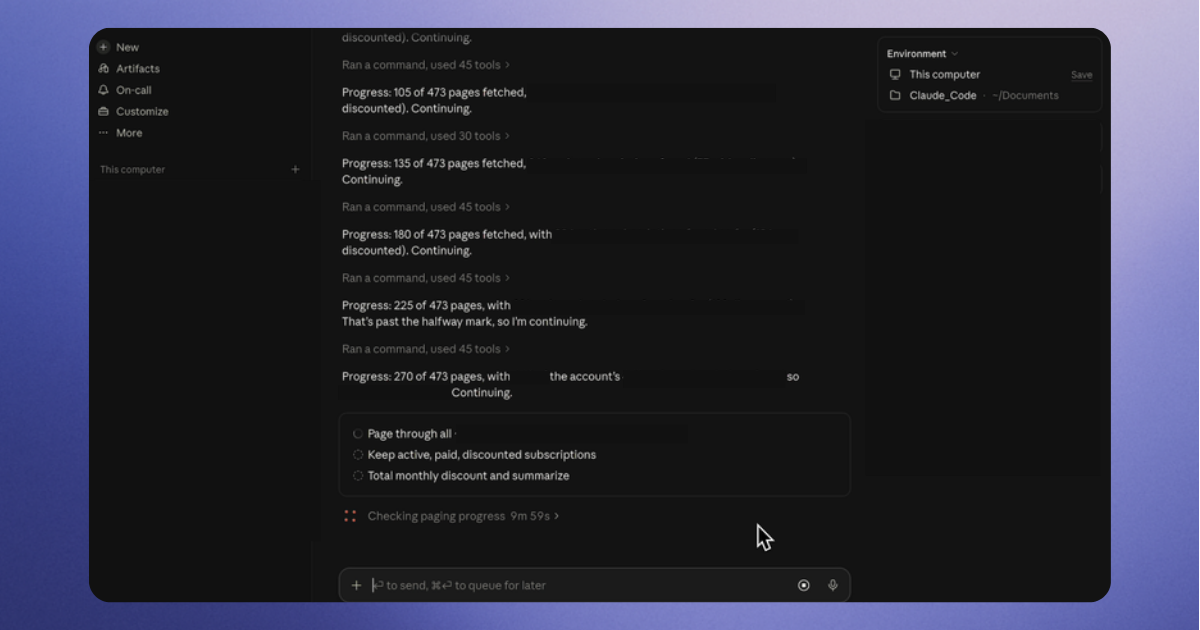
My first version of this prompt asked how much coupons cost each month, using the Coupons metric. The monthly totals came back lumpy, so I switched to reading discounts directly from subscriptions, which gives a more reliable picture.
This was the slowest prompt in my testing by far. Claude had to page through every subscription record in the account, trials and past subscriptions included, and it posted progress updates as it went, retrying pages that dropped. The result was worth the wait: every discounted subscription, the total monthly discount, and breakdowns by discount size and plan. It also checked its own work. The subscription-level discounts matched the gap between list price and actual MRR to the cent, and it told me plainly that a handful of active subscriptions were missing from its count, probably because records changed while it was paging.
For a month-by-month history of what discounts cost you, use the discount metric in the Baremetrics app, which isn't in the MCP yet.
Prepping for a customer call
Before a renewal, an upsell conversation or a tricky support call, you want the customer's billing story in one place.
12. Get a one-page brief on a customer
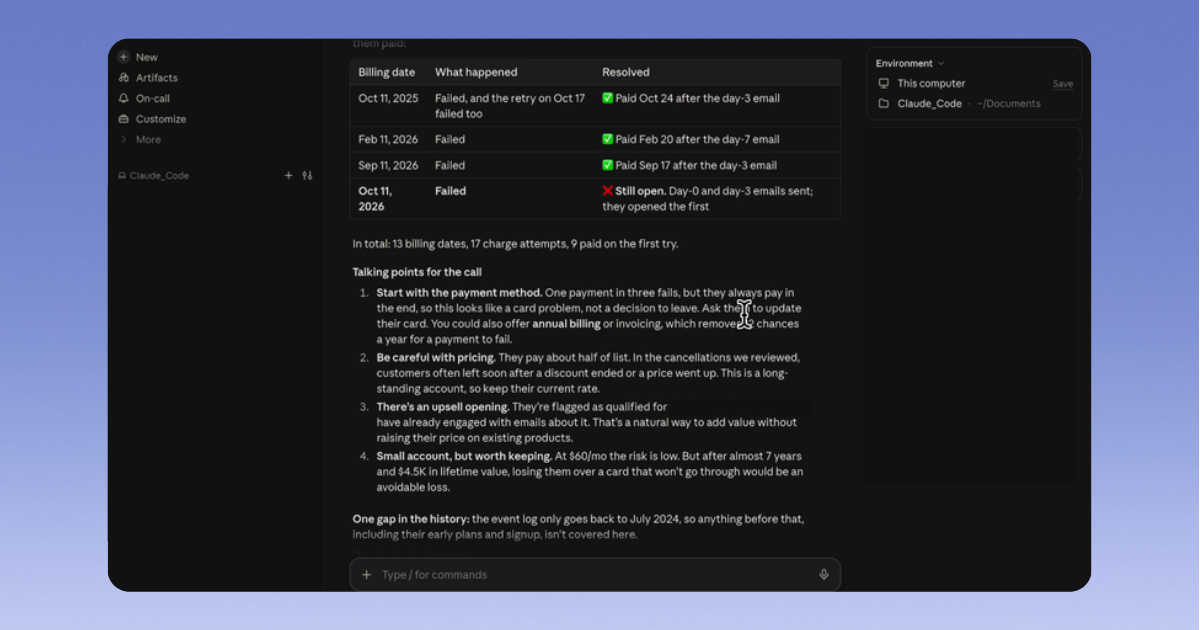
Using the Baremetrics MCP, brief me on [customer name] before a renewal call. Include their current plan, MRR, LTV, how long they've been a customer, any notes on their record, and any downgrades, refunds or failed payments in the last year.
You can search by name or email. If more than one customer matches, give Claude their payment provider ID instead (for Stripe, the cus_ ID).
The brief I got back was ready to use. It covered the customer's plans, MRR, LTV and tenure, the notes and tags on their record, a table of every failed payment and how it was resolved, and talking points for the call. It also flagged where the customer's history was cut off, so I knew what it couldn't see.
13. Combine billing history with your other tools
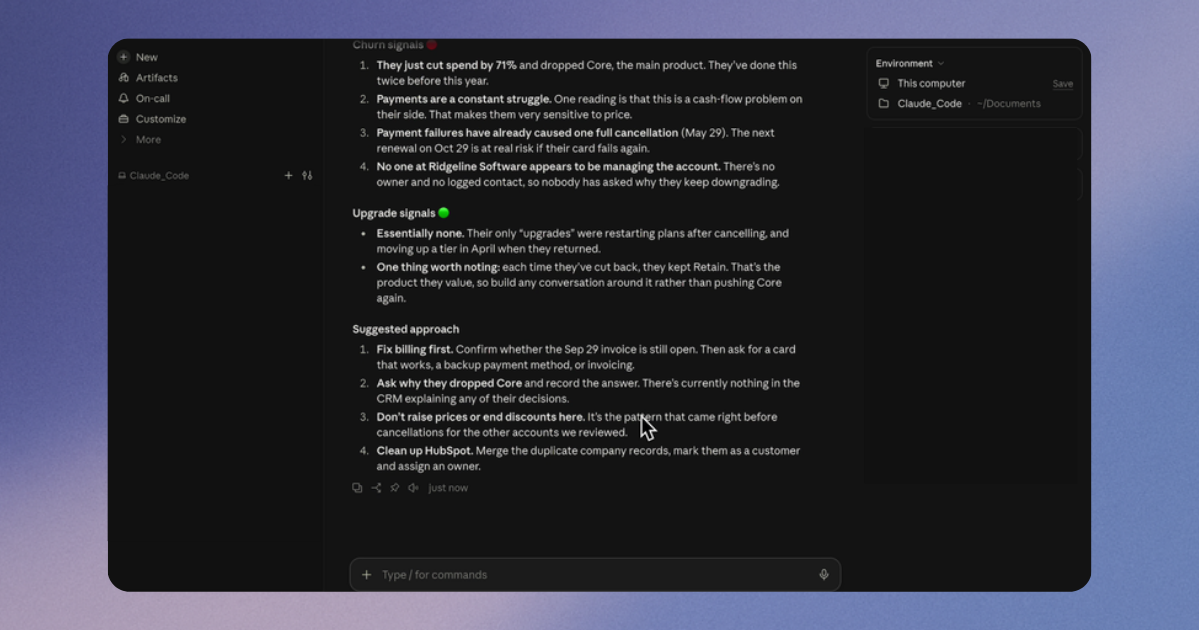
Using the Baremetrics MCP and [HubSpot, Intercom or another connected tool], brief me on [customer name]. Combine their billing history from Baremetrics with their recent [deal notes / support tickets], and flag anything that suggests they might churn or be ready to upgrade.
Claude can use more than one connector in the same conversation, so pair Baremetrics with whatever you've connected over MCP, such as HubSpot for deal notes or Intercom for support conversations. Baremetrics tells you what a customer pays and how that's changed; your CRM or help desk tells you what they've been saying. Together, they give you a fuller picture than either tool alone.
I tested this with HubSpot connected alongside Baremetrics. The CRM turned out to have no deal notes for that customer, and Claude said so instead of inventing context. It then put that gap to work: it pointed out that the CRM record was out of date and that nobody appeared to own the account, even though the billing history showed clear warning signs. Seeing the two side by side made the gap obvious.
Understanding retention by cohort
Cohorts show whether the customers you're signing up now stick around better or worse than the ones you signed up a year ago.
14. Compare how signup months retain
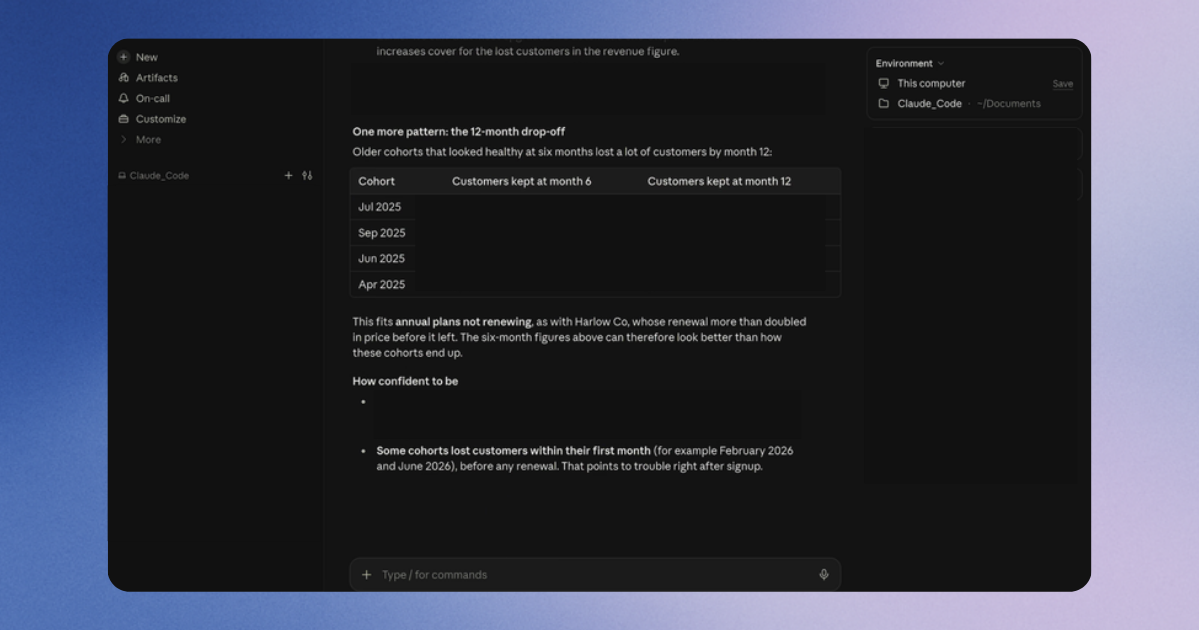
Using the Baremetrics MCP, look at my monthly retention cohorts for the last 12 months. Which signup months retain best after six months? Are recent cohorts retaining better or worse than older ones?
If you changed onboarding, pricing or your ideal customer in a given month, mention it in the prompt. Claude can then compare cohorts before and after the change. It can't tell you the change caused the difference, but it shows you whether there's a difference worth looking into.
When I ran this, Claude was upfront about the limits of the data. It noted which cohorts were too young to have six-month figures, warned that small cohorts can swing by several points with a single customer, and weighted its comparison by cohort size instead of relying on any one month. It also explained why revenue retention can go above 100% and looked past month six to see how cohorts held up at a year.
Checking revenue hygiene
Refunds, payment fees and failed charges rarely get attention until they add up. A quarterly check keeps them visible.
15. Review refunds, fees and failed charges
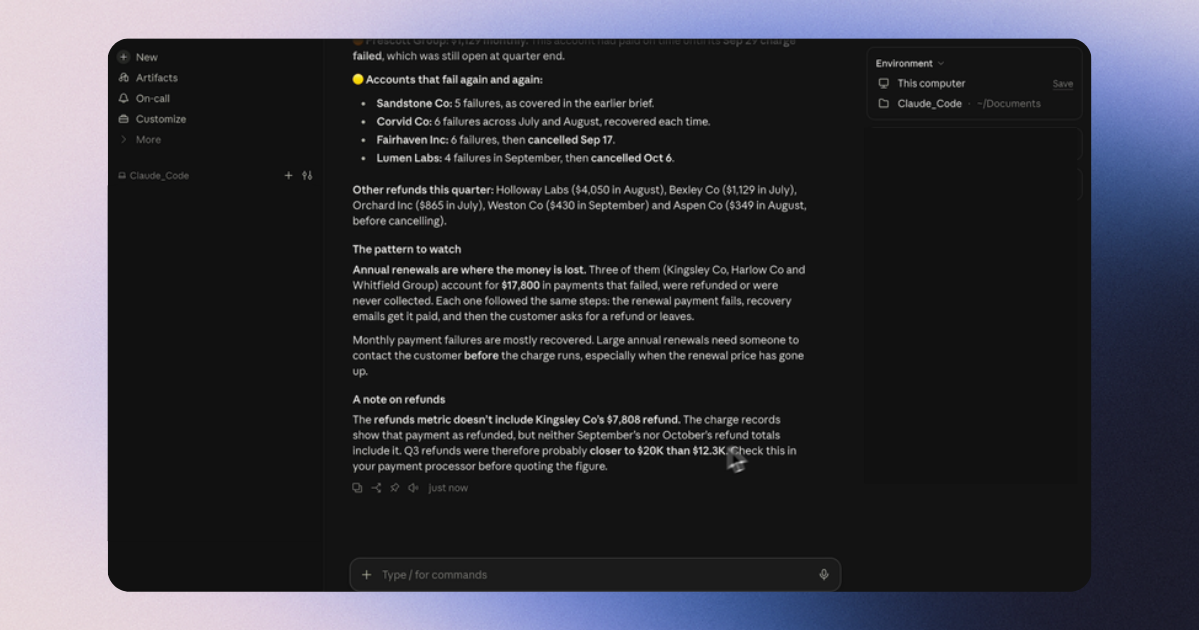
Using the Baremetrics MCP, show me total refunds, payment processing fees and failed charges for each month of the last quarter. Flag any month or customer that stands out.
This is a good prompt to ask for a table. Claude can also point out outliers, like a single customer behind most of a month's refunds, so you know where to look first.
In my test, Claude pointed out that failed-payment totals count every retry, so one unpaid invoice can show up several times. It also found a pattern I wouldn't have spotted by scanning the dashboard: large renewals that failed, were recovered, and were then refunded or cancelled. Its suggestion was to contact big renewals personally before the charge runs.
What I learned from testing every prompt
I didn't hit many outright errors, but several answers needed a second look. These habits make that easier.
Name the Baremetrics MCP in your prompt. Start with "Using the Baremetrics MCP." Otherwise Claude may answer from general knowledge or search the web instead of reading your data. I started every prompt this way, and Claude used the MCP each time.
Tell Claude how the numbers are formatted. Money comes back in cents, and churn rates come back in basis points, so 500 means 5.00%. In my tests, Claude converted both correctly without being told. If you ever see MRR 100 times too high or churn shown as 500%, that's the cause, and adding "amounts are in cents and churn is in basis points" to your prompt fixes it.
Be specific about dates. "Last month" and "the last 30 days" give different answers. Give exact dates or a calendar month when the numbers matter.
Use the answer to find the problem, then confirm the number. Claude is good at spotting trends and the customers behind them. It also showed me why that last step matters. Claude flagged a refund that seemed to be missing from the refunds total. When I asked it to recheck, it pointed out that the charge record didn't say how much had been refunded, so it couldn't be sure the total was wrong. Every other number I checked against the Baremetrics dashboard matched. For anything going to a board, an investor or a pricing decision, check the specific figures against your dashboard or an export.
Expect big lists to take longer. Lists come back in pages of up to 200 results, so a question about every subscription in a large account means many requests. In my testing, the slowest prompt was the discount check (prompt 11), which took 15 to 20 minutes because it had to page through every subscription record in the account. The full plan lineup (prompt 9) took about five minutes for the same reason. Questions that span several months can also return more data than fits in one answer, so Claude may save it to a file and work through it, which adds time. Narrowing by date or plan speeds it up.
Use payment provider IDs for exact lookups. Customer and subscription lookups use IDs from Stripe, Braintree and other providers, like cus_ or sub_ for Stripe. Names work for searching, but an ID removes any doubt.
Tell Claude the order you'd work in. If you'd normally check churn before looking at individual customers, say so, and Claude will follow your process.
Use the app for what it does best. The MCP doesn't include Forecast, Benchmarks, segments, or the Recover and Cancellation Insights reports. For those, and for charts you want to share, the Baremetrics dashboard is still the better tool.
Keep related prompts in one conversation. Claude remembers what it found earlier in the chat. In my test, the revenue hygiene answer referred back to a customer it had already covered, which saved repeating the context.
Ask for the format you want. If you plan to share an answer, ask for a table, a short summary or a set number of paragraphs. My first weekly comparison needed a second request to put it in a table I could show.
Expect very long histories to be cut short. A customer's event history comes back as the most recent 100 events, so an older customer's early plan changes may be missing. Payment history can go further back: ask for that customer's charges over a specific date range.
Ask what a metric includes when a number looks off. A metric can be defined more narrowly than its name suggests. When something seems too high or too low, ask Claude what the metric counts and whether another way of calculating it would give a fuller picture.
Start with one question
You don't need all 15 prompts on day one. Pick the job you do most often, whether that's the Monday check, the investor update or a churn post-mortem, and try that prompt first.
The MCP won't replace your dashboard. It gives you a faster way to get from "something changed" to "here's who and why," and a first draft of the write-up when you need one.
If you're not using Baremetrics yet, start a free trial and connect it to Claude in a few minutes.
Have a prompt that works well for you? Share it with me at hello@baremetrics.com.

