Table of Contents
Key Takeaways:
- Net revenue retention (NRR) is a vital growth metric SaaS businesses and startups should track
- NRR shows how much revenue you’re retaining from existing customers and uses net revenue in its calculations
- NRR should be tracked alongside GRR and customer retention to get a holistic understanding of both your ability to retain customers and expand revenue from existing customers
- Financial analytics software like Baremetrics can help you calculate and track key retention metrics including NRR
There are plenty of financial metrics that matter for SaaS businesses (which is one of the reasons why we have over 25 different financial metrics for subscription businesses in our dashboard, but a particularly important one is net revenue retention.
Retention in general— of clients and revenue— plays an important role in scaling SaaS businesses, allowing them to earn profit and grow. It doesn’t matter how much new revenue you’re generating if you’re churning it just as fast.
So today, we’re going to talk about net revenue retention, how it’s impacted by gross revenue retention and customer retention, and what you can do to maximize it.
Net Revenue: The Basics
Before we talk about net revenue retention, we need to first discuss net revenue.
Net revenue is your total earned revenue from the sale of your product minus returns and discounts.
“The sale of your product” is key here. Some businesses may earn revenue from shares, interest, or other sources, but these aren’t included in net revenue. Net revenue also does not account for expenses like rent, employee salaries, or licensing fees.
Understanding Net Revenue Retention
Net Revenue Retention (NRR) measures your business’s ability to retain revenue from existing customers over a set period of time.
Because NRR looks at net revenue, it can be slightly more comprehensive than other metrics that don’t take refunds or discounts into consideration. Your NRR gives you a solid idea of how much revenue you’re generating and retaining from customers with upsells, expansions, discounts, and lost revenue due to churn.
For example, if you have 20 customers spending $30/month and they retain for the entire period of time in question (often looked at quarterly or yearly) with no discounts or refunds, your net revenue retention is $600.
If, however, you’ve had some customers increase their plan through upsells, your NRR will increase. Let’s say you have the same 20 customers paying $30 in March, but in April 5 of those customers are paying $75 now. You’d have 15 x $30 + 5 x $75, so your net revenue would be $825.
On the flip side of the equation you have Net Dollar Retention (NDR), which calculates the percentage of recurring revenue retained from existing customers, but it’s actually a churn metric. You ca learn more in our post about Net Dollar Retention.
Net Revenue Retention vs. Gross Revenue Retention: The Differences
We already know that net revenue is your total product sales, minus discounts or refunds.
Your gross revenue is your total product sales without any subtractions. Your gross revenue retention, therefore, is your total revenue retained in a set time without any expenses deducted.
Net revenue retention (NRR) and gross revenue retention (GRR) are two important metrics. NRR reflects your ability to retain and expand the monthly spend of customers, while GRR indicates only your ability to retain customers.
An easy way to look at it is like this:
- NRR: How well do you sell to current customers? Are you upselling successfully, or are you experiencing a lot of returns or offering discounts in order to maintain the relationship?
- GRR: How well do you keep your customers happy? Is the monthly revenue retained overall?
NRR and GRR are important secondary metrics for any SaaS enterprise that brings in money through a subscription revenue model. As a result, it’s important to use tools like Baremetrics that track both consistently and accurately.
Net Revenue Retention vs. Customer Retention: The Differences
When may SaaS and subscription companies talk about “retention rate,” they’re likely talking about customer retention.
Net revenue retention and customer retention are two different metrics tracking similar things.
Your NRR looks specifically at the value of revenue retained. Customer retention determines whether or not you’re retaining specific customers. In both cases, the numbers are typically represented as a percentage but we’re using numbers for a simple explanation.
Discovering how to improve customer retention rate is a crucial part of SaaS business growth.
Have low customer retention rates? See how to turn those around with the 7 Rs of customer retention.
Let’s look at an example.
If a customer signs up for your service in March and stays in April, then the amount they spend in April is part of your retained revenue.
While I mention a customer here, note that revenue retention and customer retention are not the same thing. We’ll talk more about that in a minute.
If you have 20 customers spending $30/month, then your customer retention is 20, while your revenue retention is 20 × $30 = $600.
However, if you have a tiered pricing or usage pricing model, add-ons, or some other variability in pricing, then these numbers can change independently and both require attention.
For example, if you have the same 20 customers paying $30/month in March, but in April you have 15 customers with 10 paying $30/month and 5 now paying $75/month, then your customer retention has decreased to 18, while your revenue retention has increased to $30 × 10 + 5 × $75 = $675.
Frequently Asked Questions
What is a good NRR benchmark?
For your SaaS business to keep growing, you should aim for an NRR above 100%. While the average SaaS business does hover around 100%, pushing for a higher rate is a good way to improve your MRR. This is because it can be easier to get customers that already love and value your service to spend more than to get new clients to sign up.
What does it mean when NRR is over 100%?
An NRR that is over 100% means that your revenue increase from upsells is greater than your revenue decrease from churn. This is a good thing and is an indicator that your company is seeing revenue growth independent of new customer acquisition.
What is the maximum value of GRR?
GRR is always between 0% and 100%. In addition, your GRR is always at most equal to your NRR. If either of these is not true, then you have made a mistake and need to recalculate your GRR and/or NRR.
What’s the difference between NRR and GRR?
The only difference between NRR and GRR is that NRR includes Expansion MRR while GRR does not. In other words, NRR includes upgrades while GRR does not.
Why should you track NRR?
NRR, similar to the quick ratio, is a great metric for a direct view into the growth of your revenue stream. Tracking NRR over time will give you a better understanding of the stability of your income stream.
How does involuntary churn affect NRR?
Involuntary churn — customers lost to failed payments rather than active cancellation — pulls NRR downward without any product or customer-satisfaction problem behind the loss. The average subscription business loses around 9% of MRR to failed payments, which translates to a meaningful drag on NRR if left unaddressed. Recovering even half of that involuntary loss with a structured dunning system can lift NRR by several percentage points.
What's the fastest way to improve NRR?
Three levers, ranked by cost. Cheapest: close the involuntary churn gap with a dunning system (typically recovers 30-50% of failed payments). Mid-cost: expansion revenue from existing customers via upsells, cross-sells, or usage growth. Highest cost: reducing voluntary churn via product, CX, and pricing changes. Most subscription businesses under-invest in the cheapest lever — see our complete guide to involuntary churn.
How often should you track NRR?
Monthly at minimum, with cohort breakdowns reviewed quarterly. Annual NRR (the standard SaaS reporting metric) smooths out short-term fluctuations but hides operational signal. Monthly NRR by customer cohort or segment surfaces problems early — particularly involuntary-churn spikes that come from billing issues, processor changes, or expired-card seasonality.
NRR, Involuntary Churn, and the Hidden Lever Most Teams Miss
Net revenue retention is the cleanest single metric for measuring whether your subscription business is compounding or leaking. A NRR above 100% means existing customers are growing in value faster than they're churning out; below 100% means the opposite. Investors, boards, and operators all read NRR as the indicator of whether the business model works.
The under-invested lever in most NRR strategies is involuntary churn. Subscription businesses lose ~9% of MRR to failed payments on average — a drag on NRR that has nothing to do with product fit, pricing, or customer satisfaction. Across the 148 Baremetrics customers using Recover in December 2024, $1.35 million was reclaimed in a single month, with the median customer earning a 410% return on their Baremetrics subscription that month.
Closing the involuntary-churn portion of NRR is typically cheaper than reducing voluntary churn or driving expansion revenue. Start with our dunning management guide for the framework and recovery rate methodology guide for how to measure it honestly.
Start a free trial of Baremetrics →

How to Calculate Revenue & Customer Retention
As mentioned in the introduction, NRR is an indication of your company’s ability to retain and expand contracts. In this sense, it is similar to the SaaS quick ratio, which is also calculated using the different influences on MRR (monthly recurring revenue).
Whereas the quick ratio includes all of the following components, NRR omits New MRR and Reactivation MRR:
-
New MRR is the additional MRR from new customers.
-
Expansion MRR is the additional MRR from existing customers (also known as “upgrade MRR”).
-
Churned MRR is the MRR lost from cancellations.
-
Reactivation MRR is the additional MRR from churned customers who have reactivated their account.
-
Contraction MRR is the MRR lost from existing customers due to downgrades.
Net Revenue Retention Formula
Here’s how to calculate net revenue retention rate (NRR):
NRR = ((MRR at Start of Month + Expansion MRR) – (Churn MRR + Contraction MRR)) ÷ (MRR Start of Month) × 100%
Let’s look at an example of calculating NRR:
For example, you start March with an MRR of $50,000. Some of your customers upgrade adding $10,000 in revenue. Some customers churn leading to a loss of $3,000 in revenue, while other customers downgrade leading to $2,000 in contractions.
In this case, NRR = ((50,000 + 10,000) – (3,000 + 2,000)) ÷ 50,000 × 100% = 110%.
An NRR above 110% is an indication that you are experiencing MRR growth from current customers, which is great!
Gross Revenue Retention Formula
Unlike NRR, GRR only shows your ability to retain customers. Hence, in addition to New MRR and Reactivation MRR, GRR also omits Expansion MRR.
Let’s look at the equation:
GRR = ((MRR at Start of Month) – (Churn MRR + Contraction MRR)) ÷ (MRR Start of Month) × 100%
Let’s use the same example as above. Omitting the $10,000 in expansions, GRR = ((50,000) – (3,000 + 2,000)) ÷ 50,000 × 100% = 90%.
Since GRR is capped at 100% or your NRR, whichever is lower, a GRR of 90% is pretty good. The closer it is to 100%, the better.
Customer Retention Rate Formula
The customer retention rate is sometimes calculated instead of GRR because it is much simpler and provides a similar snapshot of your growth trajectory.
Let’s look at the formula:
Customer retention rate = (1 – (Customers Lost/Customers at the Start of the Period)) × 100%
Let’s take the same example again. Instead of $50,000 of MRR, consider there are 1,000 customers each paying $50/month. Then, 100 customers ($5000/$50) decide to leave the platform at the end of the month.
Here, the customer retention rate is (1 – (100/1,000) × 100% = 90%.
While this example is meant to be straightforward to see why customer retention rate can replace GRR, if your customers are paying different amounts, then there can be a variance between the numbers.
For example, if your high-ticket customers are more likely to churn, then your customer retention rate will be better than your GRR. Conversely, if your lower-tier customers are more likely to churn, then your GRR will be better than your customer retention rate.
NRR and GRR: Which is the Best Revenue Retention Rate to Measure?
I’m going to be very predictable here and answer the question with “both”. NRR and GRR tell you different things about your company. You also want to track your customer retention rates, too, for that matter.
I often like to say that each metric you track is designed to answer a single question about your company (If you don’t believe me, look here and look here too, as I really do say it a lot).
So, what questions are answered by NRR and GRR?
- NRR: How well do you sell to current customers?
- GRR: How well do you keep your customers happy?
NRR is a good indicator about whether you are keeping your customers buying more. This is usually done by continuing to build new services and upselling to your clients by getting them to add each new tool to their service package.
GRR tells you how satisfied customers are with your product as well as your customer service. If your clients are satisfied, then they won’t churn and your GRR will remain close to 100%.
How to Monitor SaaS NRR, MRR, and GRR
All the metrics discussed in this post— including NRR, MRR, GRR, and customer retention rates— are important for all SaaS businesses. And while manual number-crunching like NRR calculation is always possible, it’s much easier to use accurate software that can handle the calculations for you.
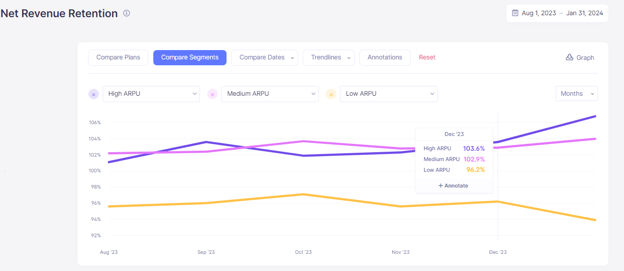
That’s where Baremetrics comes in. Our financial analytics software for subscription businesses was designed with SaaS businesses and startups in mind. So you know we’ll show you your MRR, Net revenue, MRR growth rate, quick ratio, and more. Take a look look our the dashboard:
Cutting out manual calculations and using a tool that actively monitors and tracks all your essential revenue (including, hopefully, net retention) is crucial. It’s easier to monitor retention month-over-month and it eliminates human error.
We integrate directly with payment processors like Stripe and Shopify, and we automate the process, too; we’ll pull information about your customers and their behavior and compile it into one easy-to-use, crystal-clear dashboard.
And here’s the most important part: Baremetrics, unlike many competing tools on the market, strives for true data accuracy at all times.
Many tools are capable of giving you a fairly accurate gross net retention rate, but they struggle significantly with net revenue metrics (including net retention rates). They may not show refunds or discounts, and they may fail to reflect that some customer accounts are paused, delinquent on payment, or even canceled altogether.
Baremetrics does not do this. You’ll see how customer actions like upsells, refunds, and missed payments or paused accounts are having real impacts on your net revenue retention— and that’s critical information to help you sell better and more often.
You can also see your customer segmentation and deeper insights about who your customers are, forecast the future, and use automated tools to recover failed payments.
Sign up for the Baremetrics free trial and start managing your subscription business right.
Track Complex Retention Metrics with Software
Different growth metrics tell you different things about your company.
The net revenue retention rate tells you how much your revenue from current customers is growing or shrinking from month to month.
The gross retention rate and customer retention rate tells you how well you are keeping clients signed up for your service from month to month. so regularly conducting both revenue and customer retention analysis is critical
Since a business is a complex entity operating in a dynamic world, you need to track many metrics to have a clear picture of your company’s financial health.
That’s where Baremetrics comes in.
Baremetrics is a business metrics tool that provides 26 metrics about your business, such as MRR, ARR, LTV, total customers, and more.
If you’re not sure where to get started, check out these three essential customer retention metrics to focus on for long-term growth.
Baremetrics integrates directly with Shopify, so information about your customers is automatically piped into the Baremetrics dashboards.
Tired of wasting time on spreadsheets? Get a free trial of Baremetrics today!

