 Smart Dashboards
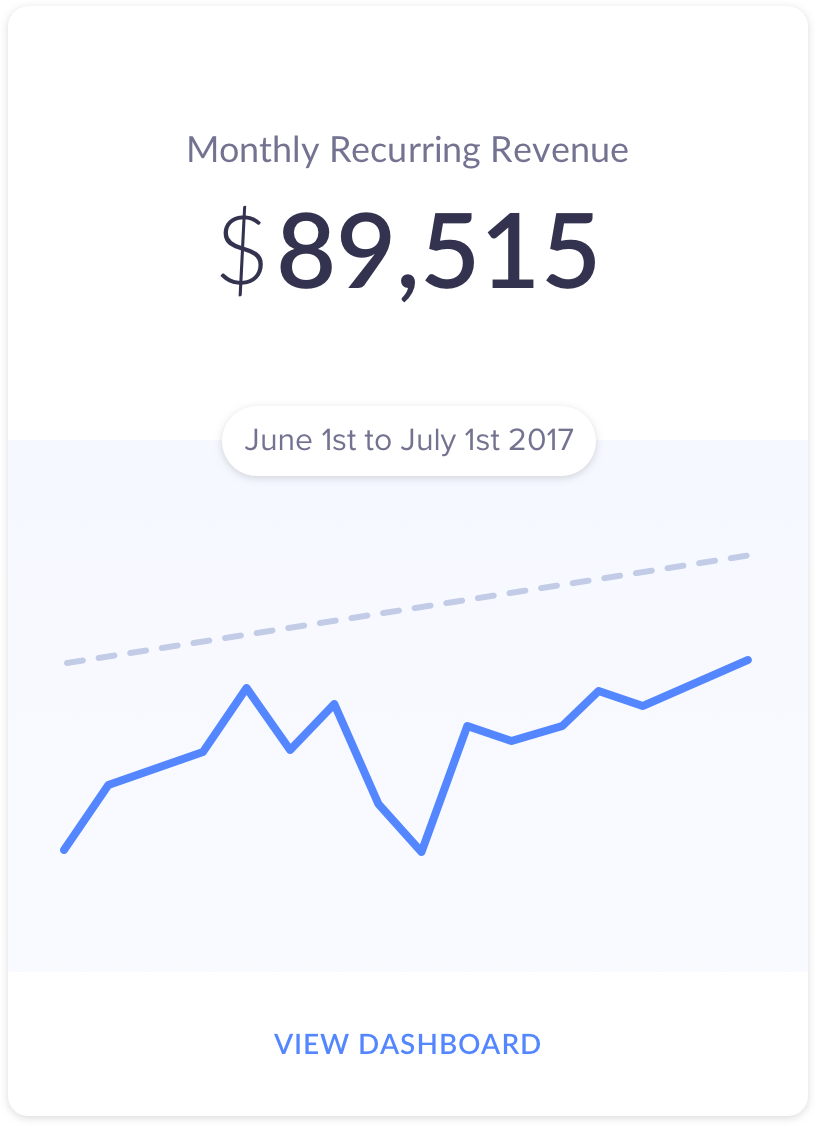
Hand crafted dashboards for everything from Recurring Revenue to Customer Churn.
 “We can now view metrics, revenue breakouts, and all the details we needed to know exactly where we were headed.”
Matt Smith, Later
“We can now view metrics, revenue breakouts, and all the details we needed to know exactly where we were headed.”
Matt Smith, Later
Powerful yet simple to use tools
Effortlessly make complex data comparisons.
Understand how your numbers stack up against each other.
Instantly compare things like dates, plans, or even numerous customer segments.

Personalize your data
View trendlines, create goals, and add comments.
With Baremetrics you can normalize your chart by selecting trendlines.
Take it a step further by creating your own business goals that you can track along the way.

Helping you find answers
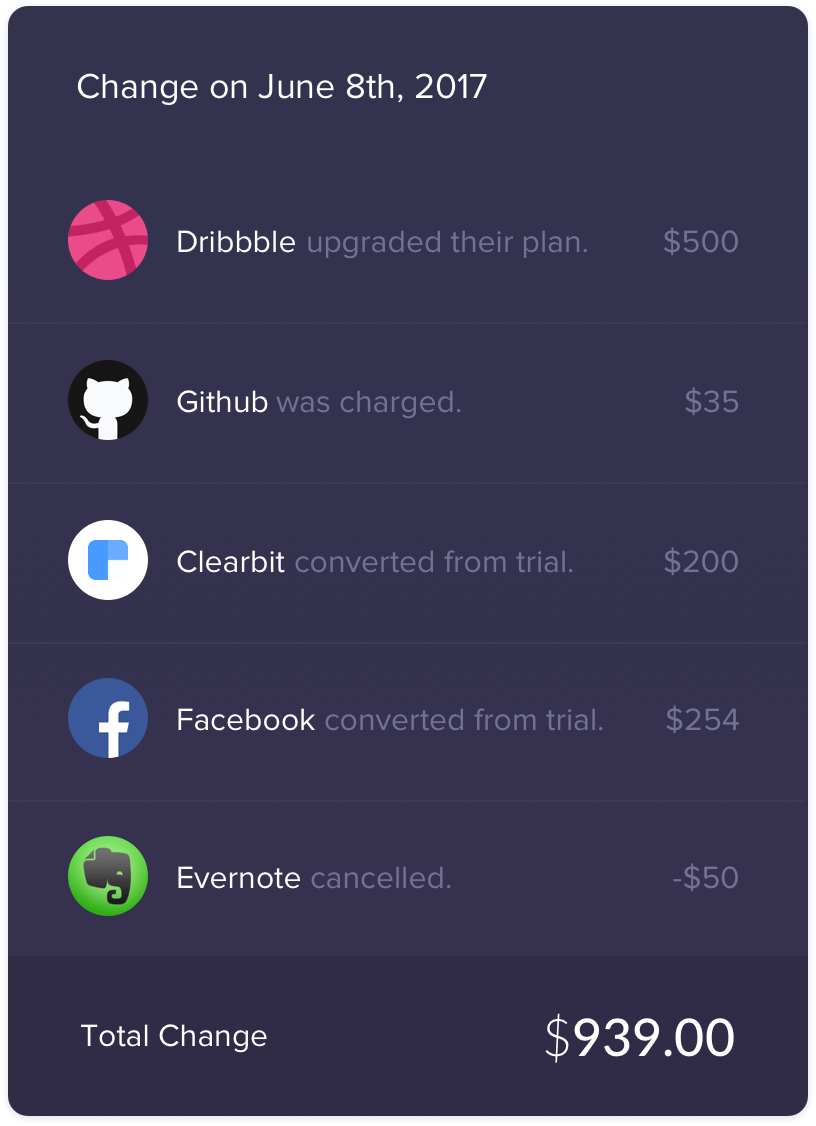
Gain clarity with data breakouts.
We created revenue breakouts to help you clearly interpret your day to day changes.
See exactly how much you’re earning (or losing) every single day.

