Product

RECOMMENDED

FREE TRIAL

Integrations

UNIFIED CONNECTIONS

View all your subscriptions together to provide a holistic view of your companies health.

Resources

AARRR Metrics Framework: What Is It and How To Use It

By Timothy Ware on December 12, 2021
Last updated on April 28, 2026

AARRR is an abbreviation that stands for “acquisition, activation, retention, referral, and revenue”. 

AARRR, often called the pirate metrics framework (as in “arr, matey”), helps Shopify Partners perfect their funnel by providing actionable metrics for each stage of the sales and marketing strategy.

In this article, we’ll go through each part of the AARRR metrics framework, why it’s useful for growing Shopify apps, and how to improve outcomes in each part of the framework. 


What is AARRR?

The AARRR framework was developed by Dave McClure, a Silicon Valley investor and the founder of 500 Startups. 

With so many vanity metrics floating around out there, the AARRR metrics provide an easy-to-remember system for tracking what matters. 

Let’s look at each component of AARRR metrics in more detail.


1. Acquisition

This is the first step in the framework. Acquisition starts with people finding you and ends with them being paid customers. 

How people find you depends on your marketing strategy. For example, an inbound marketing strategy finds customers by producing lots of high-quality content and waiting for Google to help prospective clients find you.

Alternatively, you might be relying on banner ads, Facebook ads, or Google AdSense. 


2. Activation

Activation quickly follows and overlaps with acquisition. Here is where your leads become opportunities.

While acquisition is all about getting visitors—the right visitors, specifically—to your website, activation is how you push those interested prospects to engage with your product. 

This is a two-step process. 

First, your leads take positive action towards trying your product. For example, if you have a free trial, they give that a go. 

Second, you convert your qualified leads or free trials into paying customers.

The rate by which you convert customers is your conversion rate

One way you can increase your conversion rate is by monitoring your trial data: which customers are trialing, how long your trials typically last, and which plans they sign up for. 

Baremetrics makes monitoring trial data easy by calculating your trial data in real-time: 

3. Retention

Customer retention is the most important thing you can work on as a business owner. Why? On average, acquiring a new customer can cost five times more than keeping an existing customer. 

That’s why you need to identify your customers at risk of churn right away and focus on providing an exceptional customer experience. 

There’s a few ways to do this:

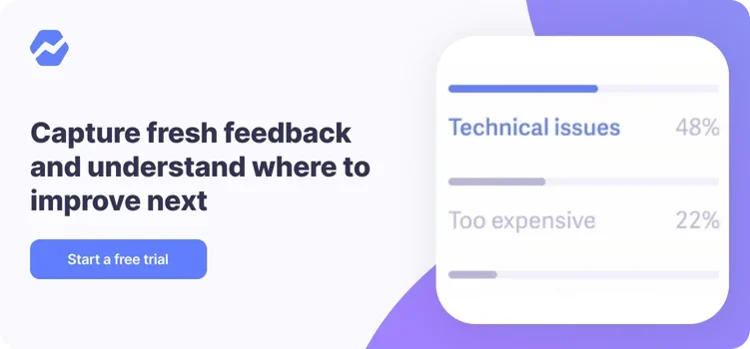
  1. Consistently ask customers for feedback 
    1. Use survey tools to gather feedback and find trends. For example, is there a particular feature that many customers feel could be improved? With this information, you can plan out the most important changes you need to make into your product roadmap and execute accordingly. 
  2. Devote resources to customer support 
    1. When your customers experience issues with your product, it should be very easy for them to get help. Be sure to set up a dedicated support team to respond to support requests in a timely manner, and while you’re at it, develop a customer onboarding process to help customers learn how to use your product. 
  3. Segment your customers and look for trends in their behavior 
    1. When it comes to retention, you’ll want to look for similarities between customers who are staying and those who are churning. You can do this with Baremetrics’ segmentation feature. By segmenting customers into segments based on common attributes,  you can answer questions like “Which price tier has the most churn?”

Let’s explore that question in the Baremetrics app. 

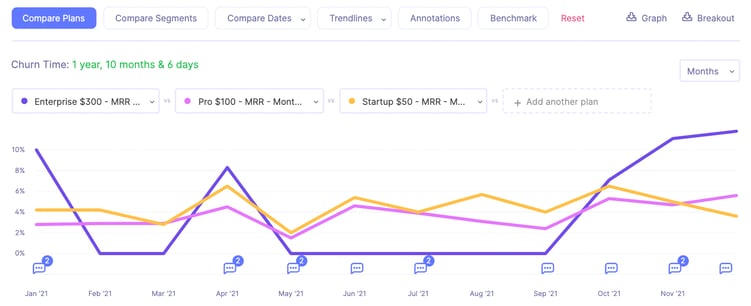
See a live demo with actual data from Baremetrics, no sign-in required!

We can see that the Pro plan (pink line) and Startup plan (yellow line) have a consistently similar user churn rate that fluctuates between 2 and 7 percent. The Enterprise plan, however, has been consistently higher than the other two plans and steadily increasing since October 2021. 

Our Enterprise customers are likely experiencing similar issues that lead to their higher churn as a segment. 

If you want to see more real-life examples of customer segmentation and how it can improve your customer retention strategy, check out our how-to guide


4. Referral

As we talked about earlier, previous stages of the framework involved converting leads into paying customers. The Referral stage, then, is when you turn your existing customers into brand advocates. 

From five-star ratings in the Shopify App Store to customer referrals, word-of-mouth marketing is a proven way to drive long-term success.

In particular, customer referrals are one of the most important groups of metrics to focus on. After all, having your customers refer others to your product is every business’s dream. It’s a genuine and low-cost way to acquire new customers.

To gauge the likelihood of your existing customers referring your product to other people, you can use the Net Promoter Score

5. Revenue

Once customers sign up as paid customers, your revenue stream begins. 

Revenue is what differentiates a hobby from a business. It is the proof that your app has value and users are willing to pay for it. 

There are many metrics to track for revenue. Some of the most popular include: 

  1. Customer acquisition cost (CAC) 
  2. Customer lifetime value (LTV)
  3. Monthly recurring revenue (MRR)
  4. Average revenue per user (ARPU)

What questions do the AARRR metrics answer?

Metrics are meant to answer simple questions about your company. Here are some examples of questions founders might ask in each stage of the AARRR framework: 

  • Acquisition: How are people discovering your product or company?
  • Activation: Are these people taking the actions you want them to?
  • Retention: Are your activated users continuing to engage with the product?
  • Referral: Do users like your product enough to tell others about it?
  • Revenue: Are your ideal customers willing to pay for this product?


Use Baremetrics to calculate your AARRR metrics

It can be difficult to calculate all the different business metrics needed to grow Shopify apps. That’s why Shopify Partners use Baremetrics. 

With a zero-setup integration, Baremetrics pulls your Shopify data and turns it into useful dashboards, like this. 

To get actionable insights about your Shopify app, start a free trial of Baremetrics.

FAQ

  • What is the AARRR metrics framework and why do SaaS founders use it?
    The AARRR metrics framework is a five-stage model covering acquisition, activation, retention, referral, and revenue, designed to help SaaS founders focus on the metrics that actually drive growth.

    Developed by investor Dave McClure, the framework is often called pirate metrics because the acronym sounds like a pirate's "arr." Its real value is cutting through vanity metrics like page views or social followers and replacing them with actionable measurements at each stage of the subscription funnel. For B2B SaaS operators, each stage maps directly to a business outcome: how users find you, whether they convert from trial to paid, whether they stick around, whether they refer others, and whether your pricing generates sustainable recurring revenue.
  • How do you measure failed payment recovery as part of AARRR revenue metrics?
    Failed payment recovery is a direct lever for protecting your revenue stage in the AARRR model, because involuntary churn from declined cards silently erodes MRR without any product or pricing failure on your part.

    Involuntary churn accounts for a significant share of subscriber loss at most SaaS companies, yet it often goes untracked until it shows up as a dip in monthly recurring revenue. Tracking failed payments separately from voluntary cancellations gives you a clearer picture of true retention. Baremetrics Recover automatically retries failed payments and sends Smart Dunning emails to recapture revenue before a subscription lapses, turning what would be lost MRR back into active subscriber revenue without any manual intervention.
  • How can I benchmark my SaaS churn rate against other subscription businesses using the AARRR framework?
    You can benchmark your churn rate against similar SaaS companies by comparing your retention metrics to open industry data segmented by MRR range, pricing model, and customer segment.

    Knowing your churn rate in isolation tells you very little. What matters is whether it is high or low relative to companies at a similar stage and business model. Baremetrics publishes open benchmark data drawn from hundreds of SaaS companies, so you can compare your monthly user churn and revenue churn against real subscription businesses rather than guessing at industry averages. Pair that external benchmark with internal cohort analysis to identify which pricing tiers or customer segments are dragging your overall retention number down.
  • What is the best way to track trial engagement data to improve AARRR activation rates?
    The best way to improve AARRR activation rates is to track trial engagement in real time, specifically which users are trialing, how long trials last, and which pricing plans they convert to.

    Trial-to-paid conversion rate is the single most important activation metric for subscription businesses. If you cannot see where prospects drop off during the trial period, you cannot fix it. Monitoring trial data alongside billing metrics lets you connect in-product behaviour to MRR contribution. Baremetrics calculates trial data automatically from your payment processor, showing active trials, conversion rates, and plan distribution in real time so your growth team can act on drop-off signals before they compound into a revenue shortfall.
  • How do I separate new MRR, expansion MRR, contraction MRR, and churned MRR when reporting AARRR revenue metrics?
    Breaking MRR into its four components, new, expansion, contraction, and churned, gives you a precise view of where revenue is growing and where it is leaking at each stage of the subscription lifecycle.

    Reporting a single MRR number hides the story. Expansion MRR from upgrades might be masking high churn from downgrades, or new subscriber growth might be offset by contracting accounts. Each component maps to a different AARRR stage: new MRR reflects acquisition and activation, expansion MRR reflects retention and referral success, while contraction and churned MRR signal retention problems. Baremetrics automatically disaggregates your MRR movements so finance leads and founders can pinpoint exactly which revenue stream needs attention without building custom spreadsheet models.
  • Which analytics tools work best for tracking AARRR metrics in a subscription business?
    The best analytics tools for tracking AARRR metrics in a subscription business connect directly to your payment processor and surface MRR, churn, LTV, and trial data in a single dashboard without requiring custom engineering work.

    Generic web analytics tools cover the acquisition stage well, but they fall short on the revenue and retention stages that matter most for subscription businesses. You need a platform that understands recurring billing natively. Baremetrics integrates with Stripe, Braintree, and Recurly with zero setup and turns your payment data into real-time dashboards covering every AARRR revenue metric: monthly recurring revenue, customer lifetime value, churn rate, average revenue per user, and customer acquisition cost payback. You can also segment your subscriber base by plan, billing interval, or custom attributes to track retention patterns across different customer groups.
  • How do I use customer segmentation to compare churn drivers between different subscriber groups in the AARRR model?
    Use customer segmentation to isolate churn patterns by pricing tier, billing interval, or acquisition channel so you can address the specific retention problem each subscriber group has rather than applying a one-size-fits-all fix.

    Churn rarely happens evenly across your user base. Enterprise customers cancel for different reasons than SMB users, and monthly subscribers churn at different rates than annual ones. Segmenting your subscriber base lets you ask targeted questions: which plan has the highest revenue churn? Which cohort of users acquired through a specific channel retains best? Baremetrics lets you divide customers by any attribute and visualise churn trends for each segment over time, so you can prioritise retention efforts on the groups where the MRR impact is highest.

Timothy Ware

Tim is a natural entrepreneur. He brings his love of all things business to his writing. When he isn’t helping others in the SaaS world bring their ideas to the market, you can find him relaxing on his patio with one of his newest board games. You can find Tim on LinkedIn.