
Table of Contents
What is gross revenue retention (GRR)?
Gross revenue retention (GRR) is the percentage of recurring revenue you keep from existing customers over a period after downgrades and cancellations, without counting upgrades or expansion. It is also called gross dollar retention (GDR). Because expansion is left out, GRR can never be higher than 100%.
GRR = (Starting MRR − Contraction MRR − Churned MRR) ÷ Starting MRR × 100
Put another way, GRR is 100% minus your revenue churn rate. Calculate it with the NRR and GRR calculator.
Last updated: November 2026
Key takeaways
- GRR measures how much existing recurring revenue you keep after downgrades and cancellations. It ignores upgrades, so it is capped at 100%.
- Formula: (Starting MRR − Contraction MRR − Churned MRR) ÷ Starting MRR × 100, which is the same as 100% − revenue churn.
- NRR adds expansion back in. GRR is always less than or equal to NRR, and the gap between them is how much your upsells are covering for churn.
- On Baremetrics Open Benchmarks, typical monthly revenue churn runs from 5.6% to 8.8% by ARPU cohort, a typical monthly GRR of roughly 91% to 94% (monthly, not annual).
- Baremetrics calculates GRR on a rolling 30-day basis from your billing data; it is the opposite of the Revenue Churn chart.
How to calculate gross revenue retention
Only count customers who were already paying at the start of the period. Revenue from customers who signed up during the period is new MRR, and revenue from customers who come back is reactivation MRR. Neither belongs in GRR.
- Starting MRR: recurring revenue from existing customers at the start of the period.
- Contraction MRR: MRR lost to downgrades.
- Churned MRR: MRR lost to cancellations.
- Expansion MRR (upgrades and cross-sells) is left out of GRR. It is what turns GRR into NRR.
GRR = (Starting MRR − Contraction MRR − Churned MRR) ÷ Starting MRR × 100
GRR calculation examples
Two examples, with NRR alongside so you can see what expansion does to the picture:
| Example 1 | Example 2 | |
|---|---|---|
| Starting MRR | $50,000 | $600 (20 customers × $30) |
| Expansion MRR (upgrades) | $10,000 | $225 (5 customers move from $30 to $75) |
| Contraction MRR (downgrades) | $2,000 | $0 |
| Churned MRR (cancellations) | $3,000 | $150 (5 customers × $30) |
| GRR | ($50,000 − $2,000 − $3,000) ÷ $50,000 = 90% | ($600 − $0 − $150) ÷ $600 = 75% |
| NRR | ($50,000 + $10,000 − $2,000 − $3,000) ÷ $50,000 = 110% | ($600 + $225 − $0 − $150) ÷ $600 = 112.5% |
In example 2, NRR says revenue from existing customers grew. GRR says you still lost a quarter of your starting revenue to cancellations, and the upgrades are hiding it. That is why the two metrics are tracked together.
GRR vs NRR: what is the difference?
Gross revenue retention and net revenue retention use the same starting MRR and the same losses. The only difference is that NRR adds expansion MRR back in.
| Gross revenue retention (GRR) | Net revenue retention (NRR) | |
|---|---|---|
| Formula | (Starting MRR − contraction − churned) ÷ starting MRR | (Starting MRR + expansion − contraction − churned) ÷ starting MRR |
| Includes upgrades and cross-sells? | No | Yes |
| Maximum | 100% | No ceiling: above 100% means expansion outweighs losses |
| Question it answers | How well do you keep your customers happy? Is the revenue you already have stable? | How well do you sell to current customers? Are upsells outweighing downgrades and churn? |
| Matters most when | You have few upsell opportunities, or you want a clean read on retention | You have tiered plans or add-ons and want to measure growth from existing customers |
| Also called | Gross dollar retention (GDR) | Net dollar retention (NDR) |
GRR is always less than or equal to NRR. If your GRR comes out higher than your NRR, or above 100%, recheck the inputs. For the full guide to the net metric, read what is net revenue retention (NRR)?; for the churn side of the same picture, see gross churn vs net churn.
What is a good gross revenue retention rate?
The closer GRR is to 100%, the better, because 100% means you lost no recurring revenue at all. Baremetrics does not publish a GRR benchmark directly, but it does publish monthly revenue churn by ARPU cohort on Open Benchmarks. Because GRR is 100% minus revenue churn, those figures translate directly into a monthly GRR range.
| ARPU cohort | Monthly revenue churn (Open Benchmarks) | Implied monthly GRR (100% − revenue churn) |
|---|---|---|
| Under $10 | 7.8% | 92.2% |
| $10–$25 | 7.1% | 92.9% |
| $25–$50 | 8.5% | 91.5% |
| $50–$100 | 8.8% | 91.2% |
| $100–$250 | 7.4% | 92.6% |
| $250 and up | 5.6% | 94.4% |
Two caveats. These are monthly figures, calculated the Baremetrics way over 30 days, so do not compare them with an annual GRR from an investor deck. And Open Benchmarks is drawn from Baremetrics customers of every kind of subscription business, so it is not a B2B-only sample. For user churn, growth and lifetime value by cohort, see SaaS financial benchmarks by ARPU.
How Baremetrics calculates GRR
Baremetrics calculates gross revenue retention on a rolling 30-day basis, straight from your billing data:
GRR = ((MRR 30 days ago − Churned MRR) ÷ MRR 30 days ago) × 100
Here churned MRR includes both downgrades and cancellations, so this is the same calculation as the formula above. GRR is the opposite of the Revenue Churn chart, which measures the percentage of MRR lost to downgrades and cancellations, so GRR = 100% − revenue churn. Customers who are delinquent for more than 30 days are treated as cancelled, and customers with 100% off coupons are treated as free users and left out of MRR.
Source: Baremetrics Help Center (Net Revenue Retention (NRR) vs Gross Revenue Retention (GRR), User and Revenue Churn, Monthly Recurring Revenue).
How to improve gross revenue retention
GRR only moves when you lose less revenue, so every lever is about downgrades and cancellations:
- Focus on customer success. Make sure customers are happy and getting the full value of the product.
- Catch voluntary churn before it happens. Cancellation Insights shows customers a personalised offer before they cancel and captures the reasons behind churn in the cancellation flow.
- Close the involuntary churn gap. Failed payments cost the average subscription business about 9% of MRR. Recover automates your revenue recovery process with email, SMS, in-app reminders and a card-update form, while payment retries stay with your billing processor.
- Watch downgrades as closely as cancellations. Contraction MRR lowers GRR just as cancellations do, and it is easy to miss if you only track customer counts.
Related metrics: net revenue retention (NRR) · net dollar retention (NDR) · gross churn vs net churn · churn rate · retention rate · all SaaS metrics formulas
Track this automatically
See your real revenue retention — connect Stripe in one click
Skip the spreadsheet. Baremetrics calculates MRR, churn, LTV and dozens of other subscription metrics straight from your billing data, and keeps them up to date.
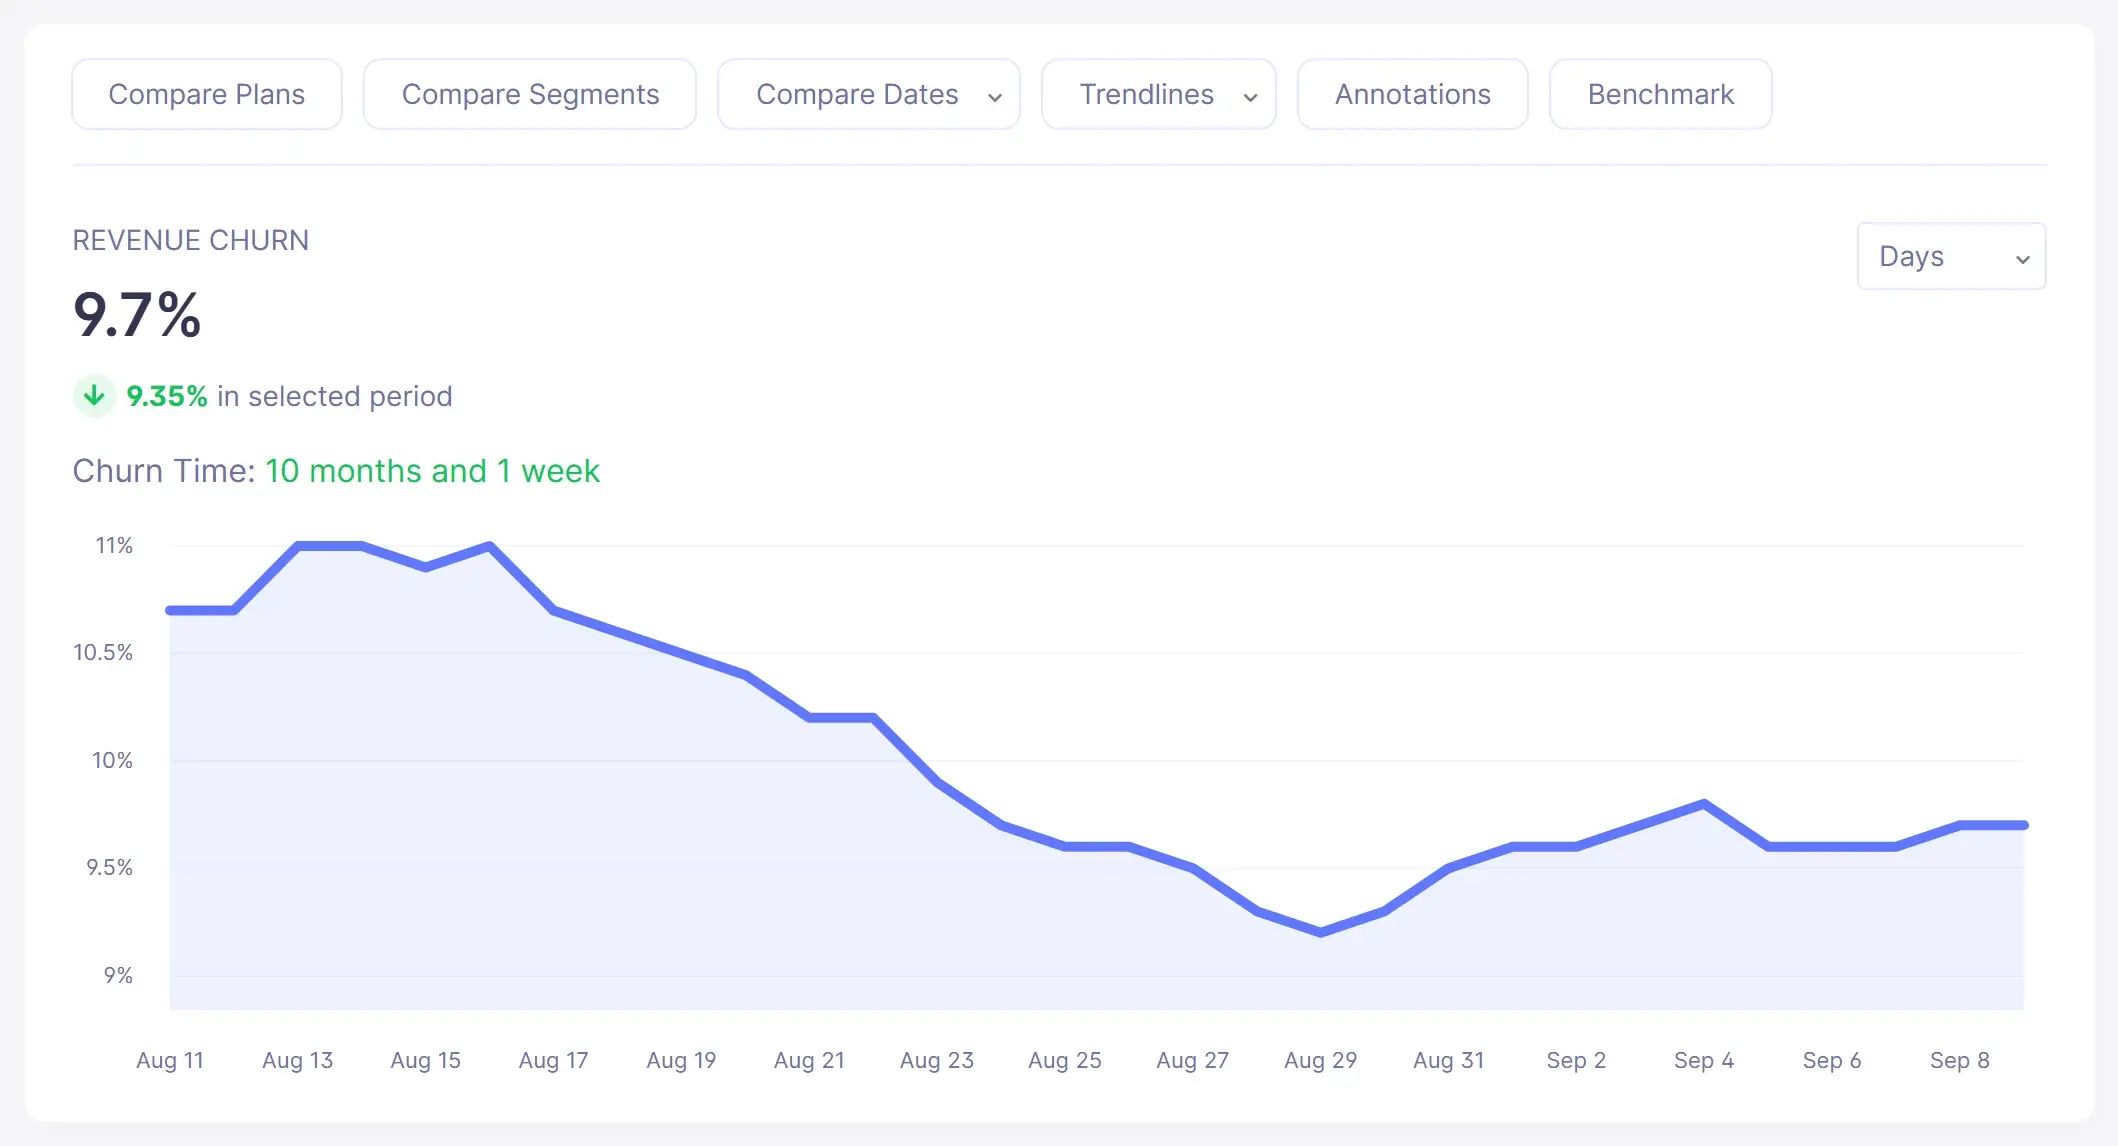
Start your free trial →or explore the live demo
Screenshot shows sample demo data.
Frequently asked questions
What is gross revenue retention (GRR)?
Gross revenue retention is the percentage of recurring revenue you keep from existing customers over a period after downgrades and cancellations, without counting upgrades or expansion. It is also called gross dollar retention (GDR). Because expansion is left out, GRR can never be higher than 100%.
How do you calculate GRR?
GRR = (Starting MRR − Contraction MRR − Churned MRR) ÷ Starting MRR × 100. If you start with $50,000 of MRR and lose $3,000 to cancellations and $2,000 to downgrades, GRR is ($50,000 − $5,000) ÷ $50,000 × 100 = 90%.
Can gross revenue retention be more than 100%?
No. GRR only subtracts downgrades and cancellations and never adds expansion, so the most it can be is 100%, when you lose nothing. Net revenue retention (NRR) is the metric that can go above 100%. GRR is always less than or equal to NRR.
What is a good gross revenue retention rate?
The closer to 100%, the better. Baremetrics does not publish a GRR target, but on Open Benchmarks (October 14, 2026) typical monthly revenue churn ran from 5.6% to 8.8% depending on ARPU cohort, which works out to a typical monthly GRR of roughly 91% to 94%. These are monthly figures, not targets, and are not comparable with annual GRR benchmarks.
What is the difference between GRR and NRR?
The only difference is expansion. NRR adds upgrades and cross-sells back in, so it shows how well you grow revenue from current customers. GRR leaves them out, so it shows how well you keep the revenue you already have, and strong upsells cannot hide a churn problem.
How does Baremetrics calculate GRR?
On a rolling 30-day basis: GRR = ((MRR 30 days ago − churned MRR) ÷ MRR 30 days ago) × 100, where churned MRR includes downgrades and cancellations. GRR is the opposite of the Revenue Churn chart, so GRR = 100% − revenue churn.
