Table of Contents
.jfif)
Many SaaS subscription products launch with prices far below their potential value. Maybe they do this to encourage sign-ups. Or perhaps it’s just a stab in the dark. Regardless of the cause, there seems to be a strong potential for increased revenue from price adjustment.
But how do we start?
This article is the introduction to a series covering various topics relevant to price optimization for subscription businesses. Here is part one! Keep reading to learn how to use data to arrive at an optimal price.
Price Optimization:
An Example Experiment

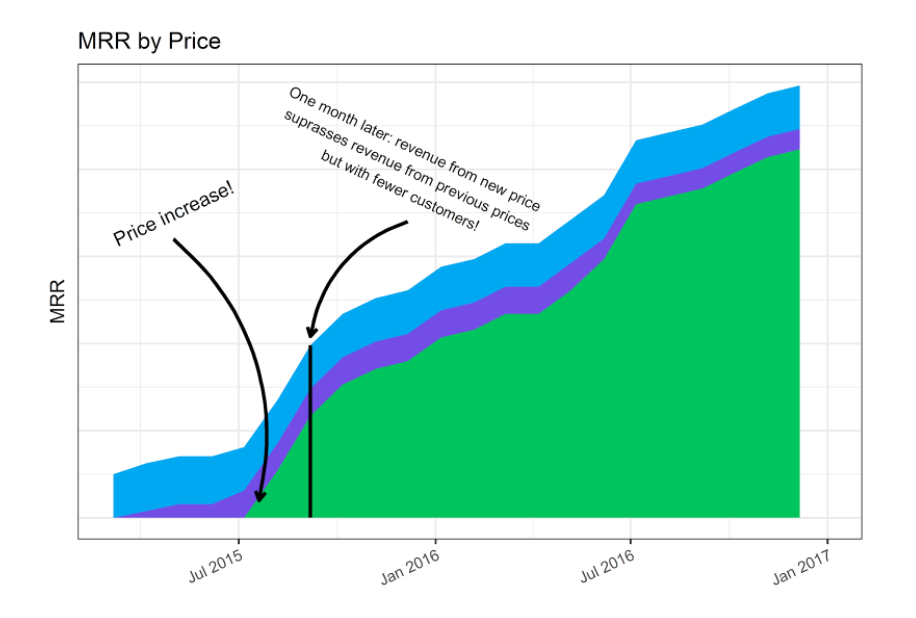
Let’s begin by looking at some actual data. Suppose we want to compare price points to see how they affect monthly revenue. Does a certain price point correspond to more revenue? Above is an example of what we might see in a real dataset. The graph comes from data from a Baremetrics customer, represented as a plot of monthly recurring revenue over time.
If optimizing subscription pricing is a priority for your business, start a 14 day free trial with Baremetrics today.
The area under the curve represents total monthly revenue. The colors correspond to the share of revenue from customers signed up at different price points. At launch, ten customers lock in a low price (blue). Then the company raises the price by 50% (purple), then by 80% (green).
After the first month of changing to the green price, thirteen customers sign up and are already providing more monthly revenue than the other customers combined. It seems that increasing the price results in a lot more monthly revenue. It raises the question, would an even higher price be better?
Let’s zoom out and look at another price change this company made:

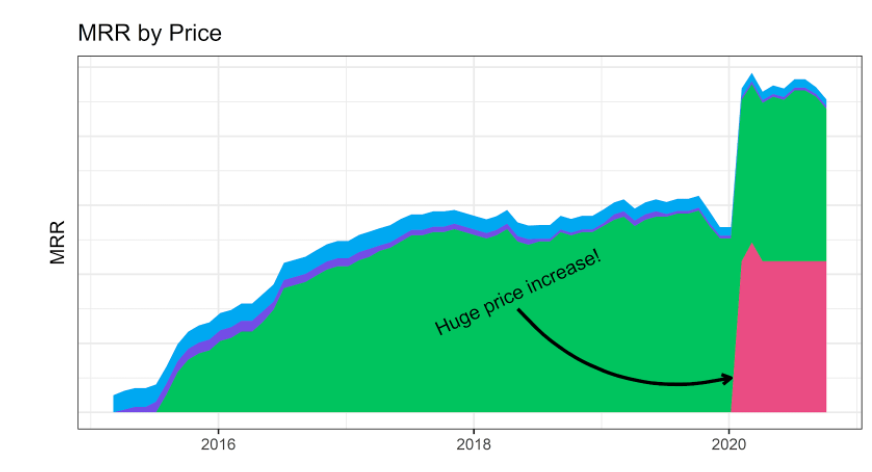
Here they make a big price increase at the beginning of 2020 (pink), six-times the launch price. They try that price for three months. In that time, ten customers join in, and it looks like revenue increases drastically.
By March 2020, out of 70 total customers, 10 are signed up at this price and they account for nearly half the monthly revenue.
While these examples are not rigorous pricing experiments, they do signal the possibility that the service is underpriced. In each example, raising the price appears to increase monthly revenue, suggesting that the price optimum is even higher than the price represented by pink.
These examples are exciting, but we need to be careful not to jump to conclusions about the relationship between price and revenue. It may look like raising the price increases revenue, but many other factors could give this result.
For example, these 10 customers that signed up in March 2020 could be caused by a special negotiation by a sales rep. Also, we have only 3 months of data with 10 data points. It’s possible they could churn quickly, or the sale is not repeatable. We need to be more intentional in our price experiments so we can avoid mistaken conclusions.
Later in this series of blog posts, we will work out a framework for experimenting with prices. Read on to learn what to measure, what exactly to optimize for, how to experiment, and how to avoid incorrectly interpreting your data.
Price Optimization: Why It’s Important
Now that we’ve offered some motivation for experimenting with prices, we need to get more specific about what we are optimizing for.
We can apply price optimization to lots of things, for example, maximizing early adopters as part of a long term strategy. But here, we are taking the narrower approach. Here we are considering the immediate response to our pricing in terms of revenue.
In other words, we want to find the price that maximizes our revenue as soon as possible.
Let’s get more specific about what we mean by revenue. We have to consider that subscriptions are at the core of our business model. We bill our customers regularly, and the longer we keep our customers, the more money we make.
This means that customer retention is a critical part of our revenue equation. It has a direct relationship to the lifetime value we get from an individual customer.
The other part of the equation is sign up rates. The value we expect to get from an individual customer is multiplied by the number of customers we attract. The price we set for a subscription will impact customer retention and sign-up rates, which determines the revenue we expect to get from our pricing plan.
In this series, we assume that somewhere in the balance of price, and its effect on customer retention and sign up rates, there is an optimum for revenue.
Our objective is to find a price closer to it, and explore experimentation around this framework.
If price optimization is an area of focus for your company, be sure to check out the rest of our Price Optimization in SaaS series.
We’ll cover useful metrics to understand our data correctly and how to set up experiments to test prices. In the absence of experimentation, we will justify some basic guidelines for developing a more optimal price.
In the meantime, jump right into finding your best pricing and start your 14 day free trial with Baremetrics today.
All the data your startup needs!
Get deep insights into your company’s MRR, churn and other vital metrics for your SaaS business.


