Table of Contents
A cohort is a group of users defined by a common and specific characteristic.
Cohorts help us measure cause and effect relationships for a defined group (cohort) without spending a billion hours analyzing individual customer journeys one at a time.
We group and categorize similar customers so that we can draw insights from behaviors quickly. You can use cohort analysis to measure the success of marketing campaigns, sales efforts, prices, and feature improvements.
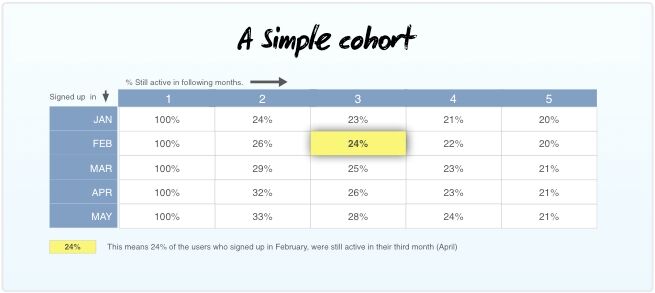
You might look at a cohort defined by weekly acquisitions like this one in Google Analytics:
Weekly cohorts in Google Analytics
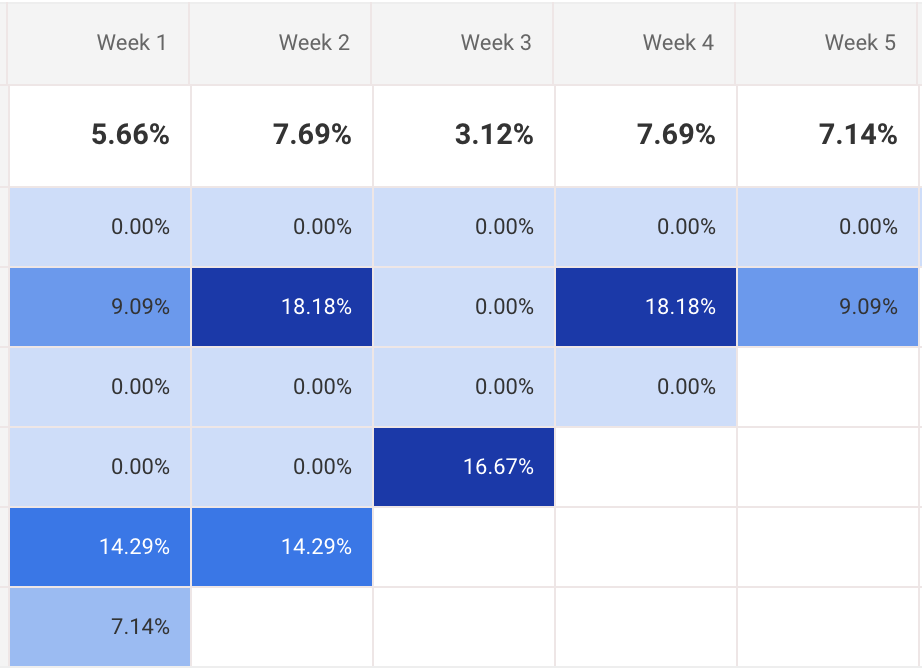
Or, you might want to know which users are most active according to their signup data cohort:
Sign up cohorts and activity
Or, cohorts can be defined by another characteristic like gender, race, or age demographic:
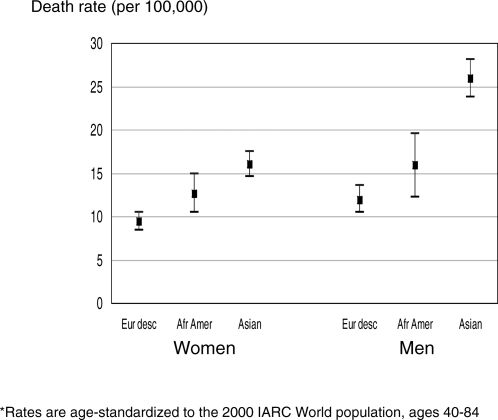
Gender and race cohorts
As you can see, with cohort analysis, we’re monitoring our defined groups over a length of time.
Time cohorts and how to use them
A time cohort is a group of users defined by a specific period of time. In SaaS, it’s most common to group cohorts by characteristics like subscription periods (quarters or months), i.e., trial signups in Q1 or new subscribers from September.
Time cohorts are helpful for comparing and analyzing the performance of a given variable. For example, let’s say you launched an ad campaign in July. You might want to compare your quarterly trial signups from July with previous months to get a quick glimpse at how your campaign affected signups.
Segment cohorts and how to use them
A segment cohort is a specific group of users defined by a characteristic other than time. An example would be users subscribed to your weekly newsletter. Or, a segment of users who use your software daily vs. users who are active only once per month.
Segment cohorts are useful for measuring success or failure. For instance, you might want to understand how many users explicitly converted from your Facebook ad during the June campaign. You’d analyze the segment cohort, “Users that converted from Facebook during June” to determine the success or failure of your Facebook ad. You could also run a comparison between the conversions from the Facebook ad and other marketing tactics you employed.
Segments can also refer to demographics like the ones mentioned above (age, race, gender, geographic location, etc.).
Create more relevant marketing messages
Cohort analysis will help you keep your marketing messages relevant. You don’t want to send a message about upgrading a subscription to a top-tier client that’s been on your highest subscription for the last year.
Measure Customer Acquisition Cost (CAC)
Cohort analysis can help us refine our CAC since we can get better insights for particular groups. For example, you might find that Facebook ads are more economical for acquiring users ages 18-25, while LinkedIn ads are best for your B2B clients. You can adjust your marketing budget to suit your new findings and get more bang for your buck.
Improve customer retention
For a SaaS business, customer retention is at the top of any department’s priority list.
A Gartner study showed:
“A full 80 percent of all future SaaS revenue will come from only 20 percent of your current customers. Therefore, an increase in customer retention of 5 percent can increase your business’s profitability by 75 percent, say researchers at Bain & Co.”
How did they find that 80% of business was coming from 20% of their customers? Cohort analysis. You can use segments to explore which of your users are 80% of your revenue. Once you know who those customers are, you can concentrate on customer success efforts to keep them subscribed.
