Table of Contents

Many companies stick with pretty basic financial systems when first getting off the ground.
Once there’s revenue coming in, the founder and their accountant may pull together a quick profit and loss statement (P&L) and make simple financial projections on a linear basis. And before substantial outside investment or really getting traction, that’s probably sufficient.
Anything more advanced is a nice-to-have, and only if there’s somehow extra time. (But as we all know, there’s never extra time!) Many founders similarly treat revenue forecasting as a luxury, making do with high-level sales projections during the initial phases of building a SaaS company.
Until suddenly, revenue forecasting becomes a necessity.
Then, to fuel the company’s growth, you’re trying to raise capital or get a loan. Or perhaps you’re looking to lease a bigger office or grow your team.
Any potential lender or investor will want a reliable revenue projection to gauge how likely you are to pay them back (ideally at a large multiple). It’s overwhelming to quickly pull together coherent numbers that reflect your business's realities and expectations.
This guide to SaaS revenue forecasting will walk you through building a revenue forecast and show you the benefits of using dedicated modeling tools.
First, the Basics: Why Is Revenue Forecasting So Important?
Forecasting is critical for any business, especially for an early-stage SaaS startup.
But to build a good forecast, you first need to define where the company is going and how you plan to get there. Then, that forecast can serve as a powerful decision-making assistant, allowing you to peer into the future and ensure that the company is moving toward the correct destination.
Revenue forecasting involves defining how much revenue you expect over a specific period, typically between one quarter and one year. This revenue forecast feeds into the P&L and serves as the basis for your five-year projections.
Remember that forecasting is more than just optimistic guessing about what’s coming. A good forecast combines historical data and future assumptions with a bit of professional judgment. Even the most sophisticated revenue forecasting models nearly always rely on human input at one phase or another.
In short, forecasting helps you and the rest of the team constantly answer the question: is what we’re doing taking us where we want to go?
Initially, it may be hard to convince yourself of the revenue forecast’s value. Especially early on, when there’s no finance team handling the details, you already have a lot on your plate. You might assume that putting together a forecast takes time away from your ‘real’ business of:
-
Building better products,
-
Selling your software, and
-
And hiring new developers.
However, securing capital to invest in the business is part of the founder’s job. It can be hard to get investors on board without reliable financial projections or a model showing when the company will become cash-flow positive. And all serious financial projections, including your P&L and cash expectations, hinge on the revenue forecast.

Building a Revenue Forecast in Google Sheets
In SaaS, the revenue forecast drives decisions in many aspects of the company by ensuring you can answer critical questions like:
-
How much can we afford to spend on marketing?
-
Will we need more customer support staff?
-
Is our funnel converting as many customers as it should?
-
How much cash are we burning each month?
-
When will we run out of runway?
To forecast well, you’ll need to understand the business’s financial and marketing history and adapt based on upcoming changes and expectations.
It’s not only the past that plays a crucial role, and a startup’s internal plans can also have significant impacts.
-
How quickly can you implement the new features customers are craving?
-
When are the new sales managers starting?
-
What options are available for driving more traffic?
-
Can we improve conversion rates?
You may assume your company’s sales will continue increasing. But how can you be sure? Or will growth taper off, and you’ll get stuck at a plateau?
Don’t linger too long in the analysis phase of finding the perfect modeling solution. Before implementing automated tools, it’s generally helpful to begin revenue forecasting with a simple, accurate spreadsheet model.
We prefer Google Sheets. And in fact, we’ve got a great template you can use. Just make a copy and follow along:

One significant advantage of using a spreadsheet is that you’re forced to map out the entire marketing funnel and sales process. Building the relationship between your CRM and financial reporting tools lets you see what factors have the most considerable impacts and where your biggest levers are.
Then, after becoming familiar with what’s driving your sales, you can consider moving on to more advanced tools.

Basic Forecasting Options
The most straightforward forecasting tools rely on the recent past to predict the future. The “straight-line” method uses historical revenue and growth trends to map high-level revenue expectations.
Start with your last six months of data and map out the next six months based on your current trajectory. For example, if you had $50k in monthly recurring revenue six months ago and today you have $60k, a straight-line forecast would show that in 6 months, you’ll hit $70k in MRR.

The 2020 target line follows a straight-line model.
A steady growth projection is probably a very conservative estimate for a SaaS startup with solid growth. Although some fluctuation month-to-month is standard, simple linear growth is unlikely, especially if you’ve already got some traction.
When your product has caught on and the customer base is growing, shifting from a strictly linear model to a moving average calculation can drastically improve your forecast’s accuracy.
At Baremetrics, we call this an Autopilot forecast. Instead of growing at a flat rate each month, your growth rate will change depending on the performance of the prior 3-6 months, eventually leveling out.
This way, you’re capturing the growth rate of the past few months and changes to revenue growth.
Creating a Revenue Model
Once you’re comfortable with the basics of revenue forecasting, it’s time to move on to a more complex revenue forecasting model. Now is when you’ll really get into the weeds to understand the basic building blocks of how your revenue comes together.
As I said before, we’ve got an effective SaaS forecast template that you can use as a basis:
Like we did with a simple forecast, start by gathering as much relevant historical data as possible. If you’ve been in business for five years but have only seen traction over the last six to eight months, it’s okay to neglect the earlier info. Data from the first four years might not provide much insight into your future growth.
In terms of relevant information, we’re after financial data as well as marketing, sales, and other customer metrics. The “other” data is critical because it helps you anchor your model in what’s driving customer and revenue growth.
Customers don’t magically appear. They generally start as visitors to your website and move through the different steps of your funnel. A handful will eventually convert and become paying customers – adding to your MRR.
Ideally, set up the template so that you can directly paste an export from your financial system and CRM tools. Of course, our template is built to take actual figures from a Baremetrics export. Still, google sheets are pretty flexible, and you can quickly adapt your export or input sheet to suit your specific needs.
Baremetrics Export within the SaaS Financial Model 3.0
1. Your funnel model
Start by mapping out your marketing funnel data and customer signup information. Historical data here will give you a picture of how your funnel works.
-
How many visitors did you have to your website, and where did they come from? Do you get a lot of organic traffic, or is it mainly through PPC advertising, like AdWords?
-
Of those visitors, how many signed up for your email list? Together, these figures give your visitor to signup conversion rate.
-
Next you have your conversion rates from Signup -> MQL (marketing qualified lead), MQL -> SQL (sales qualified lead), and SQL -> Opportunities -> Trials.
-
Finally, a certain percentage of those trials will indeed become new customers.
You might be thinking: Hey, wait a minute! Why are we spending all this time on the marketing funnel? I thought we were building a revenue forecast!
First things first, we’re getting there. Almost all new customers flow through your marketing funnel. Understanding each funnel step and conversion rate helps you see the complete process behind your revenue generation.
2. From funnel to “new customer”
Here’s where forecasting shifts from being something of a math exercise to more of an art. After mapping out your historical funnel data, analyze the formulas and how your conversion factors have moved over the past few months. Then, make your best guess of what ratios are reasonable going forward.
Our marketing funnel template’s conversion rates for Organic and AdWords traffic default to a 3-month moving average. This assumption provides an excellent basis for capturing the latest trends, but conversion rates can be sensitive to even minor adjustments at any funnel stage.
Suppose improvement actions run on specific funnel aspects, or you know you’re about to release significant updates or fun new features. In that case, you might want to adjust some conversion factors manually.
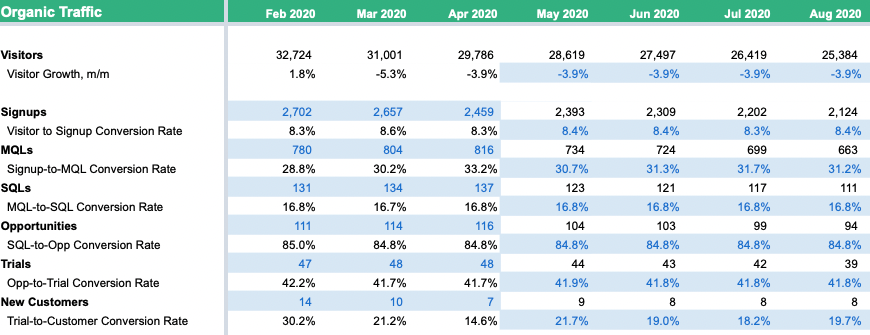
In this example, the forecast started in May 2020. You might notice that organic visitors are expected to continue shrinking -3.9% month over month.
Also, because the standard formulas are based on the previous three months, as you project further and further into the future, the conversion metrics eventually level out.
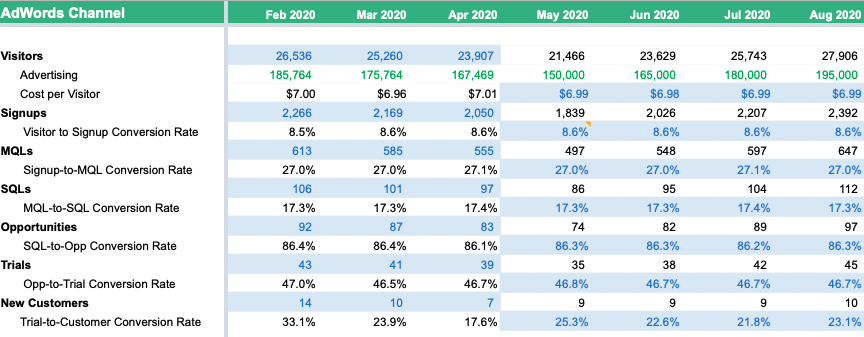
When planning AdWords (or any PPC) traffic, the number of visitors depends on the expected advertising budget and the cost per visitor. Here, the assumption is that you can always buy more traffic and are limited only by your budget.
This expectation further enforces the position that your revenue forecast affects what you can afford to spend on advertising. There’s a flywheel effect in the sense that more revenue growth drives more revenue growth, at least until you reach market saturation.
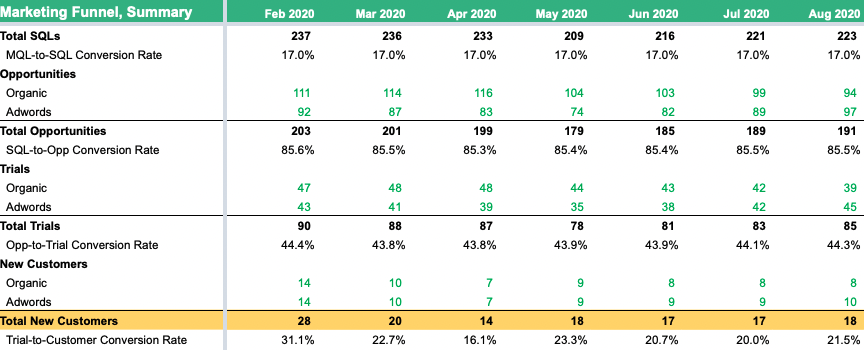
3. Revenue forecasting models
The two marketing channels combine to give you the number of new customers your marketing funnel will generate each month. Revenue from these customers flows into your new MRR, where we’ll pick up the second part of your revenue forecast.
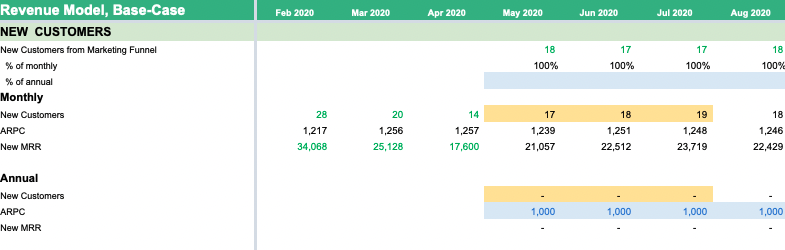
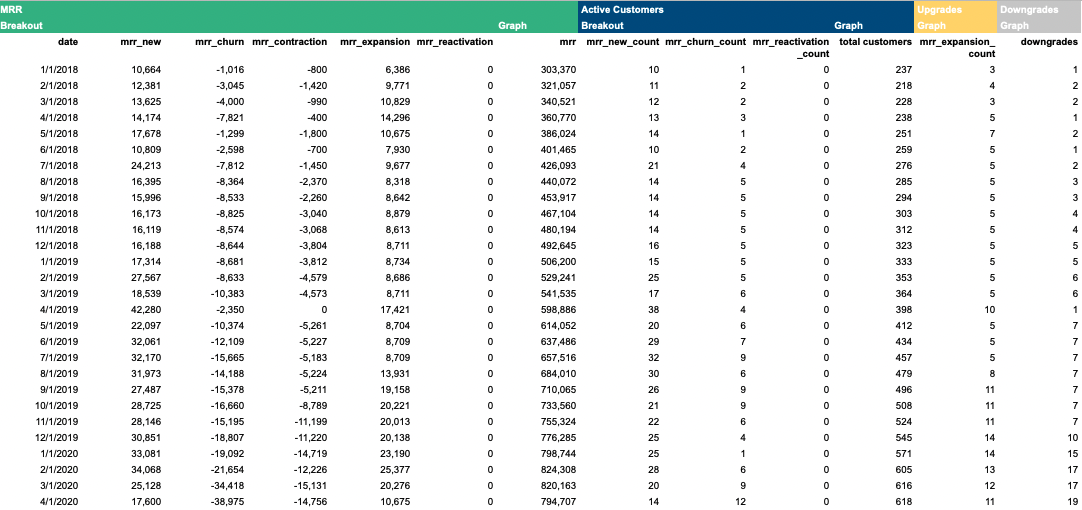
Aside from attracting new customers, there are a few significant factors impacting MRR:
-
Expansion and contraction (subscription upgrades or downgrades): This happens when existing customers decide to move to either a higher or lower pricing tier.
-
Churn and reactivation: customers canceling subscriptions or reactivating a previously canceled subscription. You’ll see below that there is some churn, although we don’t have any reactivation in this example.
Instead of using a moving average as we did previously with most of our conversion rates, these percentages are hard-coded to reflect our expectations for expansion, churn, and contraction.
While tweaking conversion rates in your marketing funnel can significantly impact the number of monthly new customers, churn and reactivation can also impact MRR.

4. Converting customers to MRR
We’ve effectively established the total number of customers we expect each month from the marketing funnel to our expectations for expansion, churn, and contraction. Using these figures and the average revenue per customer (ARPC) for each category, we can make a solid prognosis for MRR.
Maintaining Your Revenue Forecast
Once you’ve established your revenue forecasting formulas and the data relationships necessary to build your forecast, it’s simply a matter of refreshing the data and assumptions each month.
You’ll be able to copy your traffic and conversion data directly from your marketing funnel software. Then, input your revenue and churn information. If your assumptions were way off, go ahead and reassess for the next forecast.
That whole process shouldn’t take much time but can provide insight into what’s working and what isn’t. The real work involves assessing where you’re not on track with your previous assumptions, making decisions, and taking corrective actions.
Critical Takeaways for Revenue Forecasting
Revenue forecasting is essential, especially for SaaS businesses. Don’t wait until you’ve got an entire finance team ready or investors to be satisfied to implement the most advanced cloud forecasting solutions. Getting started with a Google Sheets tool is massively better than not forecasting at all.
However, the problem with relying on a flat spreadsheet model is that simplicity and accuracy often have an inverse relationship.
In other words, it’s unlikely to be accurate if it’s simple.
The other extreme applies, too; if it’s accurate and you attempt to capture all the factors that drive your SaaS revenue, it’s probably not simple. And with spreadsheets, not simple can be both error-prone and challenging to maintain.
Imagine the difficulty of regularly adding an additional marketing channel or a new service level and pricing tier to our simple example. It’s doable, but you’ll need to connect all the data points without double-counting anything properly. Over the long term, companies with a broad customer base and complex product palette will become too much for a simple tool.
Forecast+: An Alternative to Spreadsheet Forecasting
Spreadsheet models have their place in the business world. Many great companies have been built using only spreadsheets for financial modeling.
However, many effective alternatives are available to growing startups. A cloud solution like Forecast+ can be extremely valuable for helping SaaS companies handle their forecasting and financial planning. It also integrates with financial software like Xero and QuickBooks to seamlessly import your actual data each month.
With a one-stop forecasting tool, you can do everything a spreadsheet can and more. It’s transparent and flexible, and updating is extremely easy.

Operating Model inside Forecast+
Forecasting and modeling serve several vital purposes. But those purposes mostly boil down to assisting internal decision-making and modeling financial trajectory to potential (and existing) stakeholders.
Tools that help you spend less time to gain more insight can bring immense value. Imagine linking your forecasting tool directly to your financial reporting system. This would save you from manually importing data or ensuring your formulas are correctly linked.
Beyond that, tools like Forecast+ can make visualizing multiple scenarios a breeze.
Modeling Multiple Scenarios
Scenario modeling helps you prepare and position yourself for whatever life throws at your business. Periodically taking a little time to model several situations enables you to get ahead of the data to ensure you’re prepared for the worst but shooting for the best.

Base, Target, and Worse Case Scenarios in Forecast+
Typically you’ll look at 2-3 main scenarios:
-
The target scenario is what your team is aiming for. This “best-case” outcome shows what happens when you make aggressive assumptions and most things go right.
-
The base case is more of a standard scenario. These revenue estimates are somewhat conservative and something you can easily beat under normal circumstances. A good starting point for this “baseline” is your average performance over the past few months.
-
In the worst case, you prepare for what to do when everything falls apart. This scenario involves modeling what happens in a coronavirus-like situation or if war should break out in areas where you have an extensive customer base, causing revenue to drop 20+% suddenly. It's not likely, but it's also not impossible.

The ability to instantly visualize all of the effects – including balance sheet and cash flow impacts – helps to make sure the entire team understands the impacts of each scenario.
The Ease of Modular Modeling Systems
One of the other significant advantages of using a modeling tool is the modularity of its work. Unlike a spreadsheet model, a modular tool allows you to add new components to your forecasts without rebuilding the entire model.
In Forecast+, you can quickly drop exports from your accounting tools or downloads from your customer metrics software and adapt your model. The same applies to adding a new scenario or products and marketing channels.
In the long run, this can save a lot of time and ensure your model doesn’t unintentionally exclude critical data.

Automated Forecasting and Finances
The level of sophistication necessary for your financial tools depends on the purpose of the forecast and the target audience.
If your primary objective behind building a forecast is to get better control over your business simply, the Google Sheets model you started with might cover your bases for a while. However, creating and updating it might be a manual process, where you might risk making severe errors in assumptions or calculations.
Because you know there’s actual data behind the spreadsheet projections, you can feel comfortable showing them to potential investors or loan underwriters.
However, suppose you’re trying to convince VC investors or a bank that your SaaS business has a solid upward trajectory. Then, it might be time to invest in switching from spreadsheets to an automated modeling and reporting tool like Forecast+.
After the initial setup is complete, you can automate some of your business’s running and reporting.
The Bottom Line
With Forecast+, Baremetrics gives you the tools to build a great revenue forecasting model for your growing SaaS business. The flexible financial planning tools let you model what the future brings, no matter what.
When you’re ready to get all of your business’s metrics in one place, start your free trial today.
