Table of Contents

Operating model
The Operating Model contains Profit and Loss, Balance Sheet and Cash Flow statements, all displayed on top of each other in a monthly format.

Structure of the Operating Model
Seeing actuals and forecasts side-by-side helps to ground your forecasts in reality. I’ve seen models where founders enter historical values with a mentality of “this is what I think happened”, instead of relying on their actual data from accounting (=what actually happened).
Almost as bad of an alternative is where someone manually types in every single line-item from their accounting. Needless to say this is very time-consuming and still error-prone.

Prepare data export tabs
A better way to get your accounting data into the Operating Model is to utilize Data Export tabs.
These exports are designed to pull in data in a consistent format, which means you only need to copy-paste the export from your accounting into the model to update it with the latest data.
In the following examples, let’s follow a company called Southeast Inc, which sells some obscure SaaS to airports around the world. They’re making about $700k in MRR, still make net losses, but work on becoming cash flow positive in the coming months.
In the examples below, I’m using Quickbooks Online (QBO), but you can pull similar exports out of Xero as well. The structure in our example books follows SaaS best practices for expense categorization, but the template will work fine even if your books look different.
In QBO, navigate to Reports on the left and select Profit and Loss. Select All Dates for the report period, and make sure to display columns by month. This structure ensures your historical export structure doesn’t change from month to month, and only new months are added as new data comes in.
Next, export the report. Open the export in Google Sheets or Excel, and copy and paste the contents into the Profit and Loss Export worksheet:
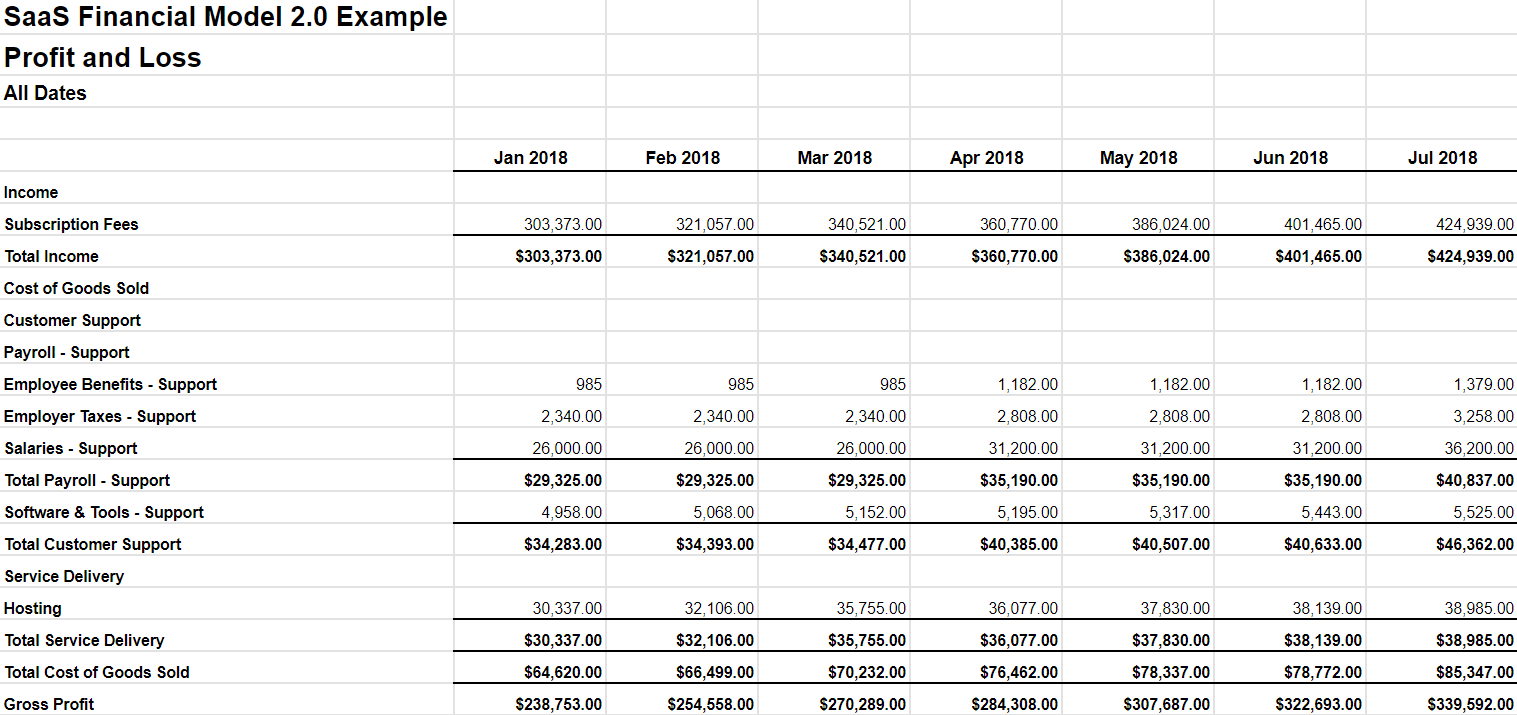
Profit and Loss Export from Quickbooks Online
Repeat the same process for Balance Sheet and Statement of Cash Flows (=Cash Flow Statement) in their respective tabs.
Fill in operating model actuals by using data exports
You’ll want to pull the content of these three exports into the Operating Model. The goal is that after the initial setup, you’re able to just drop in new exports on a monthly basis with minimal effort. We’ll do that by using Named Ranges.
Let’s start with the Profit and Loss, or PnL.
In the example tab of Profit and Loss Export, I’ve named the spreadsheet column A (the “range”) with the PnL account names as PnL_Accounts. The month columns have named ranges following a syntax of statementName_mmm_yyyy. Say, PnL_Jan_2019.
I have named the months from January 2018 to April 2020 to give you a fast start.
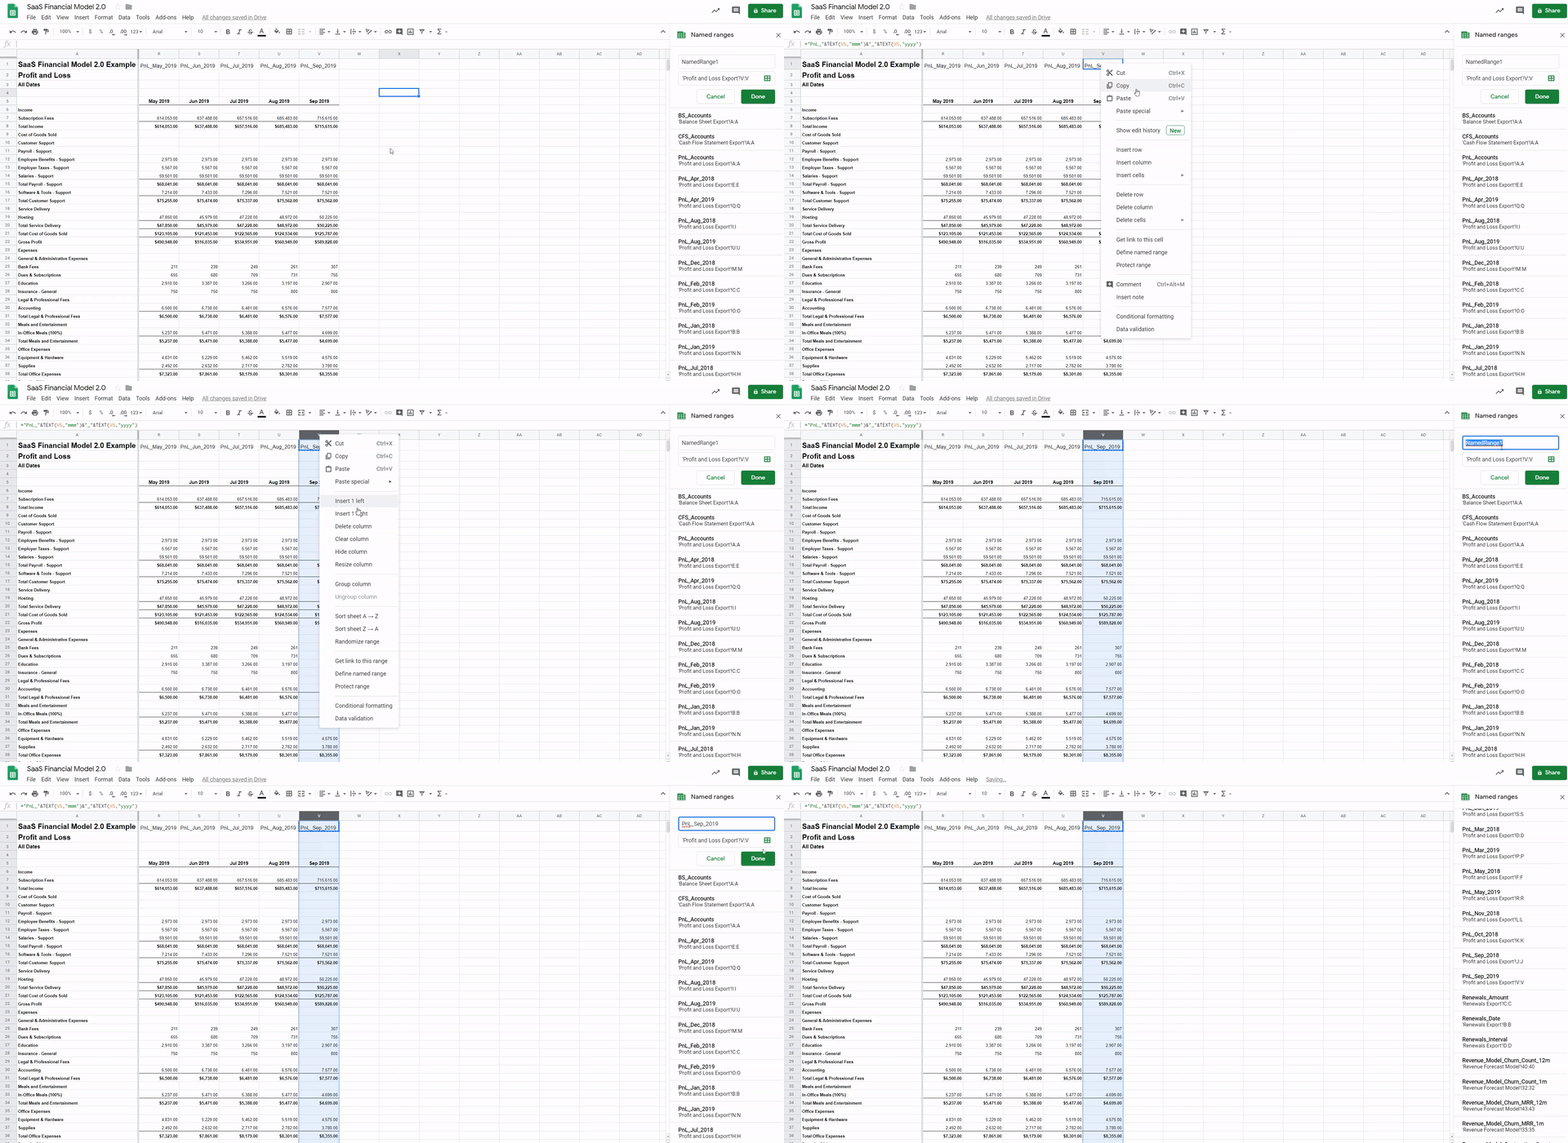
You’ll only have to name the months that I haven’t named already.
If you read this post in June 2020 and begin building your model, you’ll only need to add a named range for May 2020. If you have historical data beyond January 2018, you’ll need to add named ranges for each month you want to pull into the Operating Model.
Again, make sure your columns match mine exactly, i.e. April 2020 is in Column AC and not any other column.
The goal of this rather complex setup is to be able to use a consistent formula on the Operating Model that pulls in actuals from each export tab.
Repeat for Balance Sheet and Cash Flow Statement tabs. Please note the different prefix (BS and CFS), as they differ from the one used in the formula to pull in the Profit and Loss (PnL) actuals.
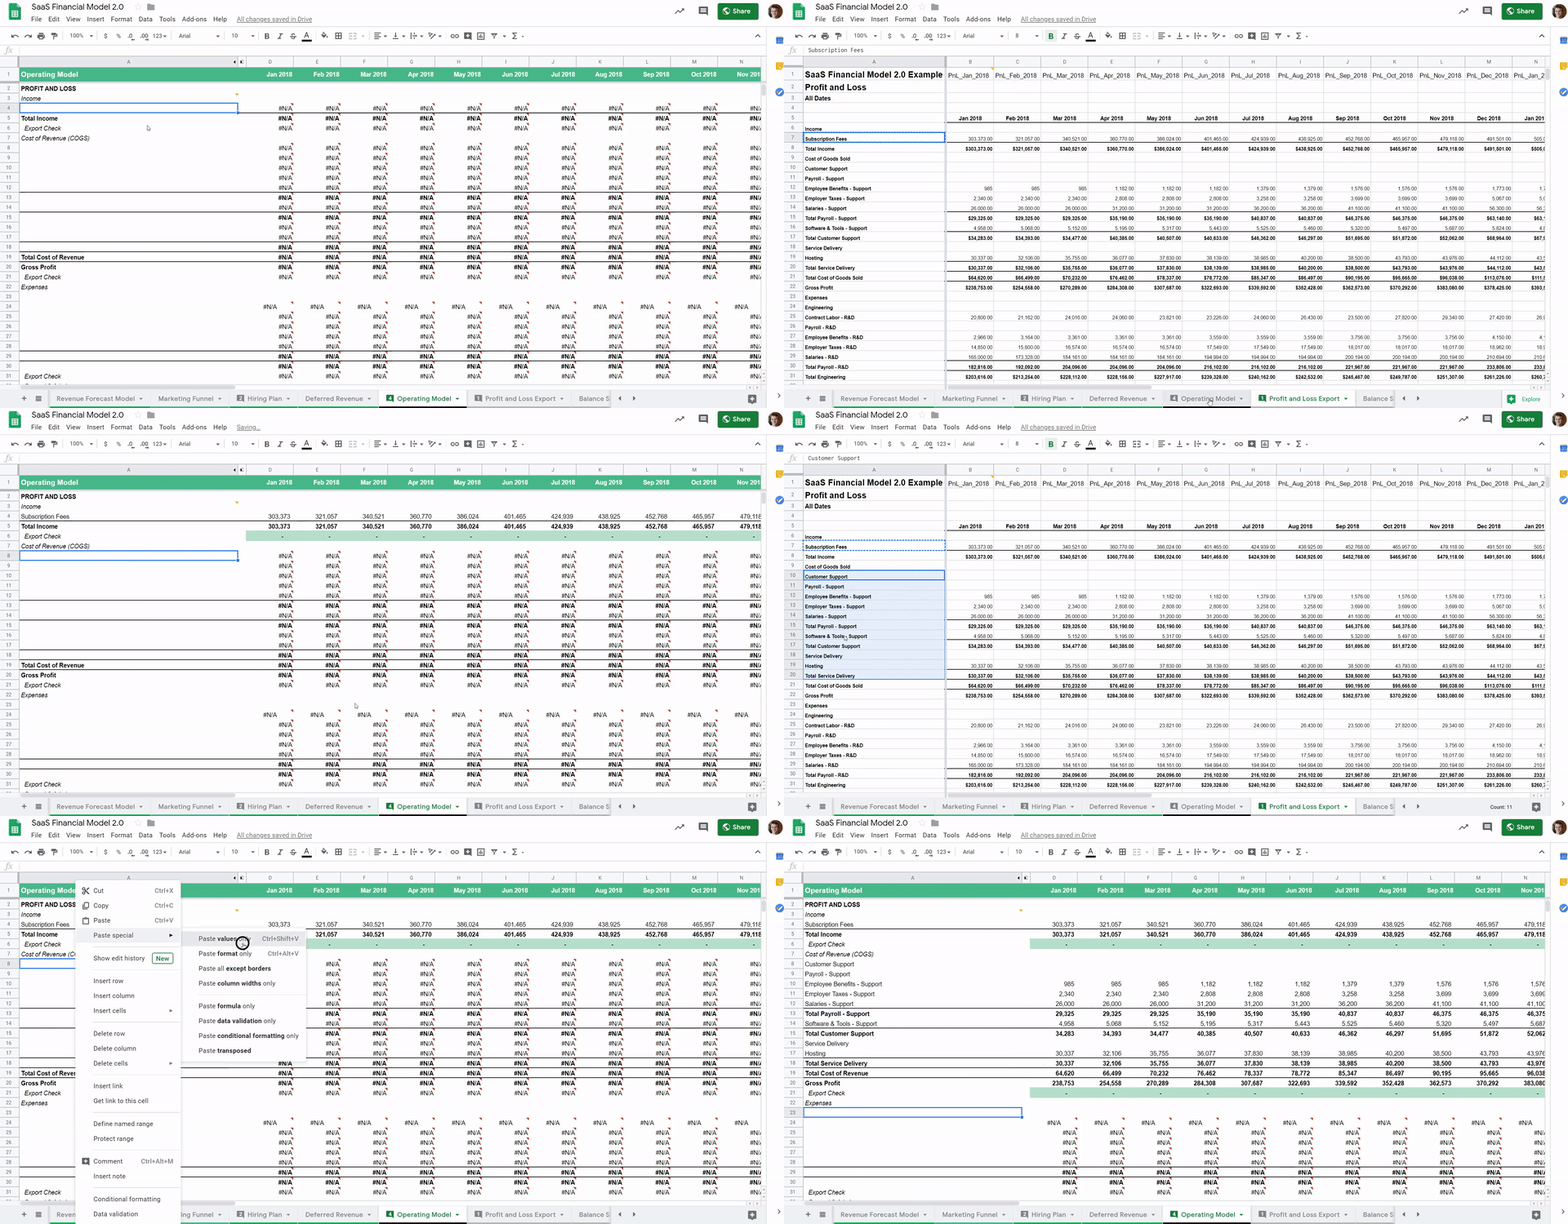
Copy and paste account names into operating model
After naming your exports ranges, we need to tell the Operating Model what exactly we want to pull in each month.
Start by copying each account name from your PnL tab into the Operating Model, followed by BS and CFS. You can either clear out the Operating Model from the account names I use (pictured below), or rename the accounts to fit what’s in your books. Feel free to add more rows as needed.
This takes a good 20-30 minutes, but don’t worry. You’re doing this just once—with the rare exception when your accountant adds more accounts to your books. (Once you have a solid Chart of Accounts, this really shouldn’t happen too often).
Use the formula to pull in the export data
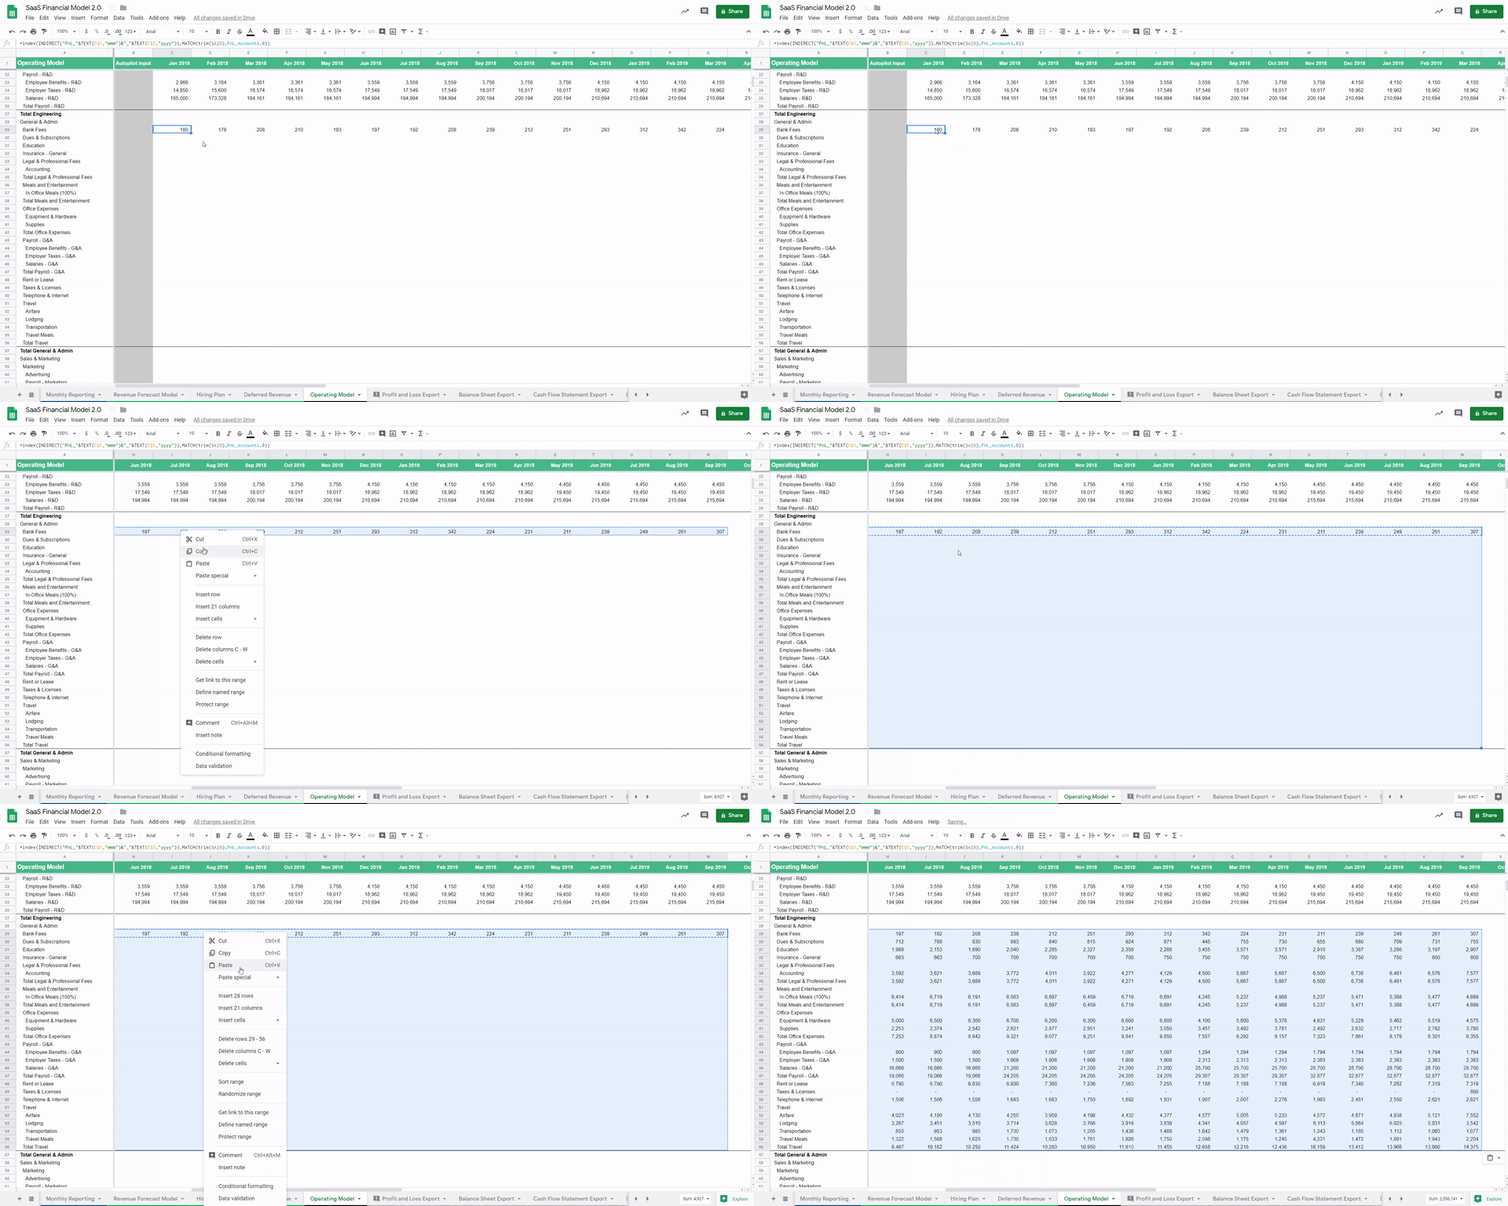
Now, we finally get to pull in data. The formula I use appears a little hard to read, but what it does is actually quite simple. The first part of the formula looks up the current month from the export, and the second part ensures we’re pulling the exact account name from column A.
Drag this formula to cover all the actual months you want to pull into the Operating Model. I recommend pulling at least the current year and the previous one:
Repeat the process for Balance Sheet, but remember to use the formula from the Balance Sheet section, as it changes the formula prefix from PnL to BS.
Next, make sure the “Total” formulas include everything you just modified.
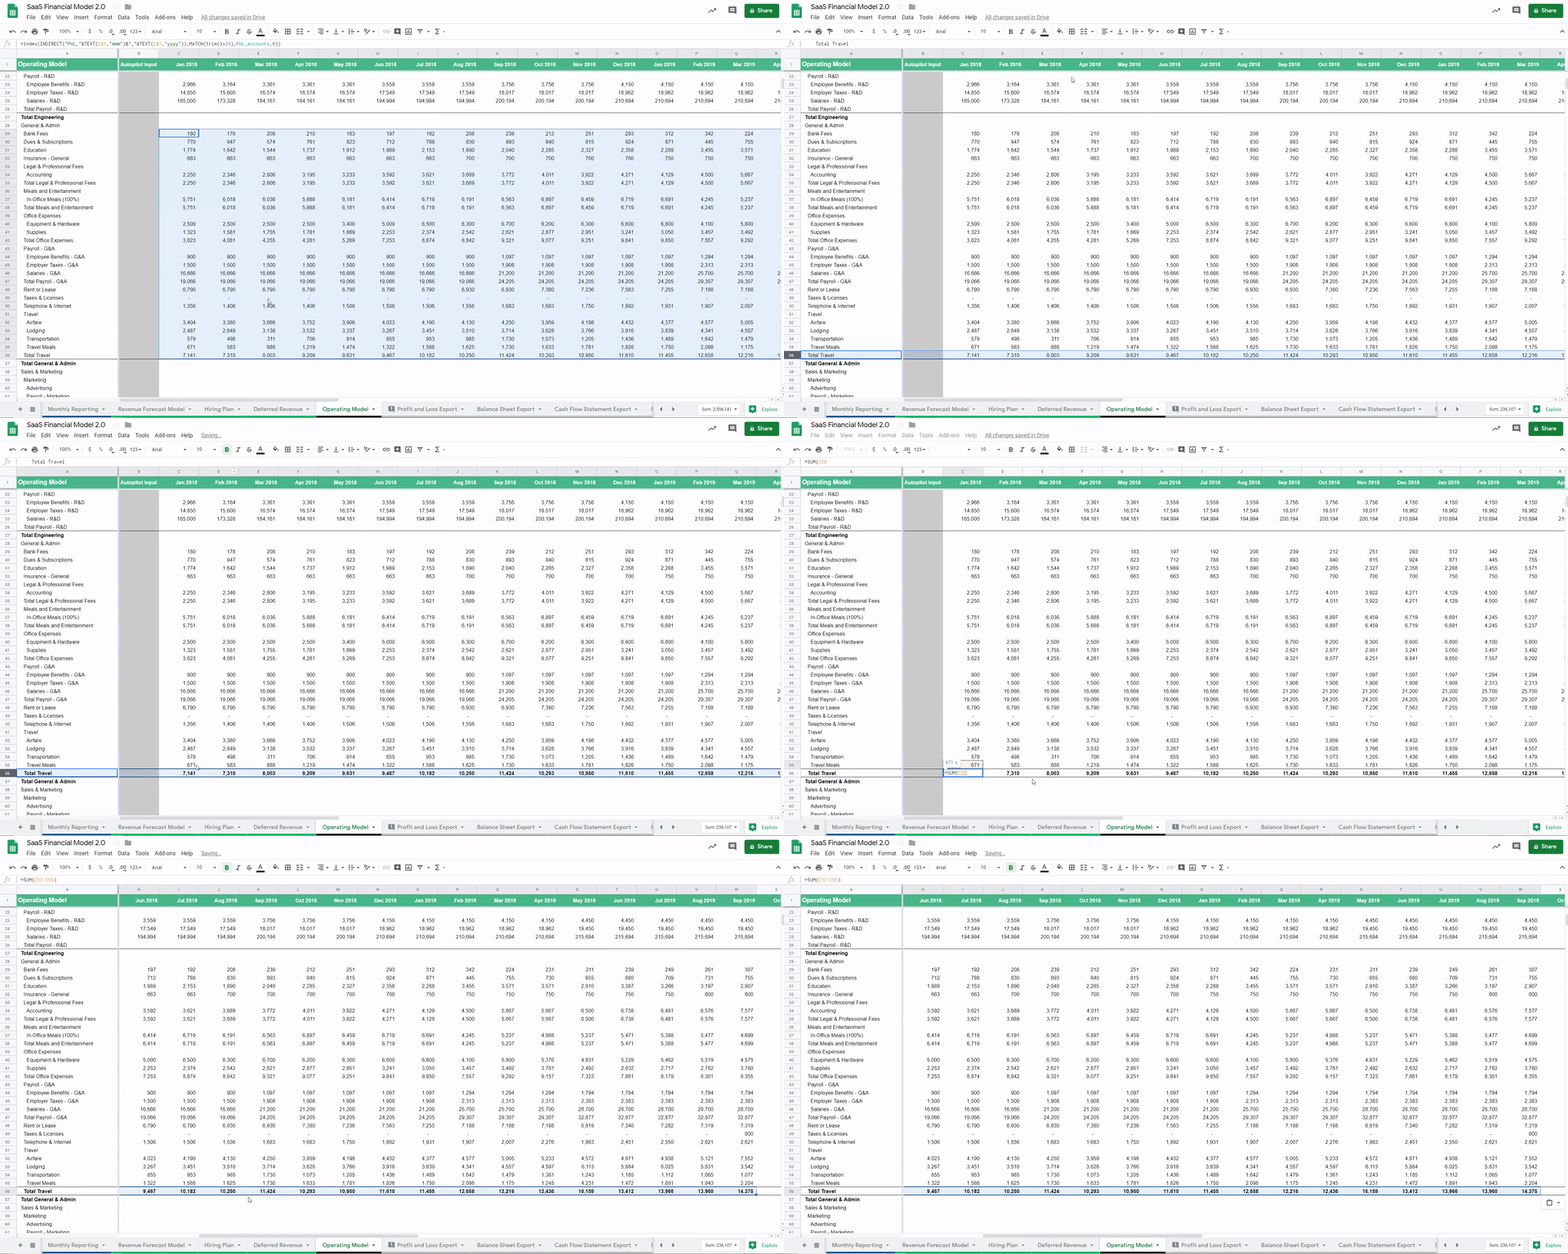
The green sanity checks for the totals are extremely useful as I can immediately see if my Operating Model is missing an account that’s present in the PnL.
Note that the formula structure breaks if you don’t have unique account names in your QuickBooks. For example, if you have two “Salaries” accounts. The way to get around it is to give unique names to each of your accounts, which is a good practice you should follow anyway.
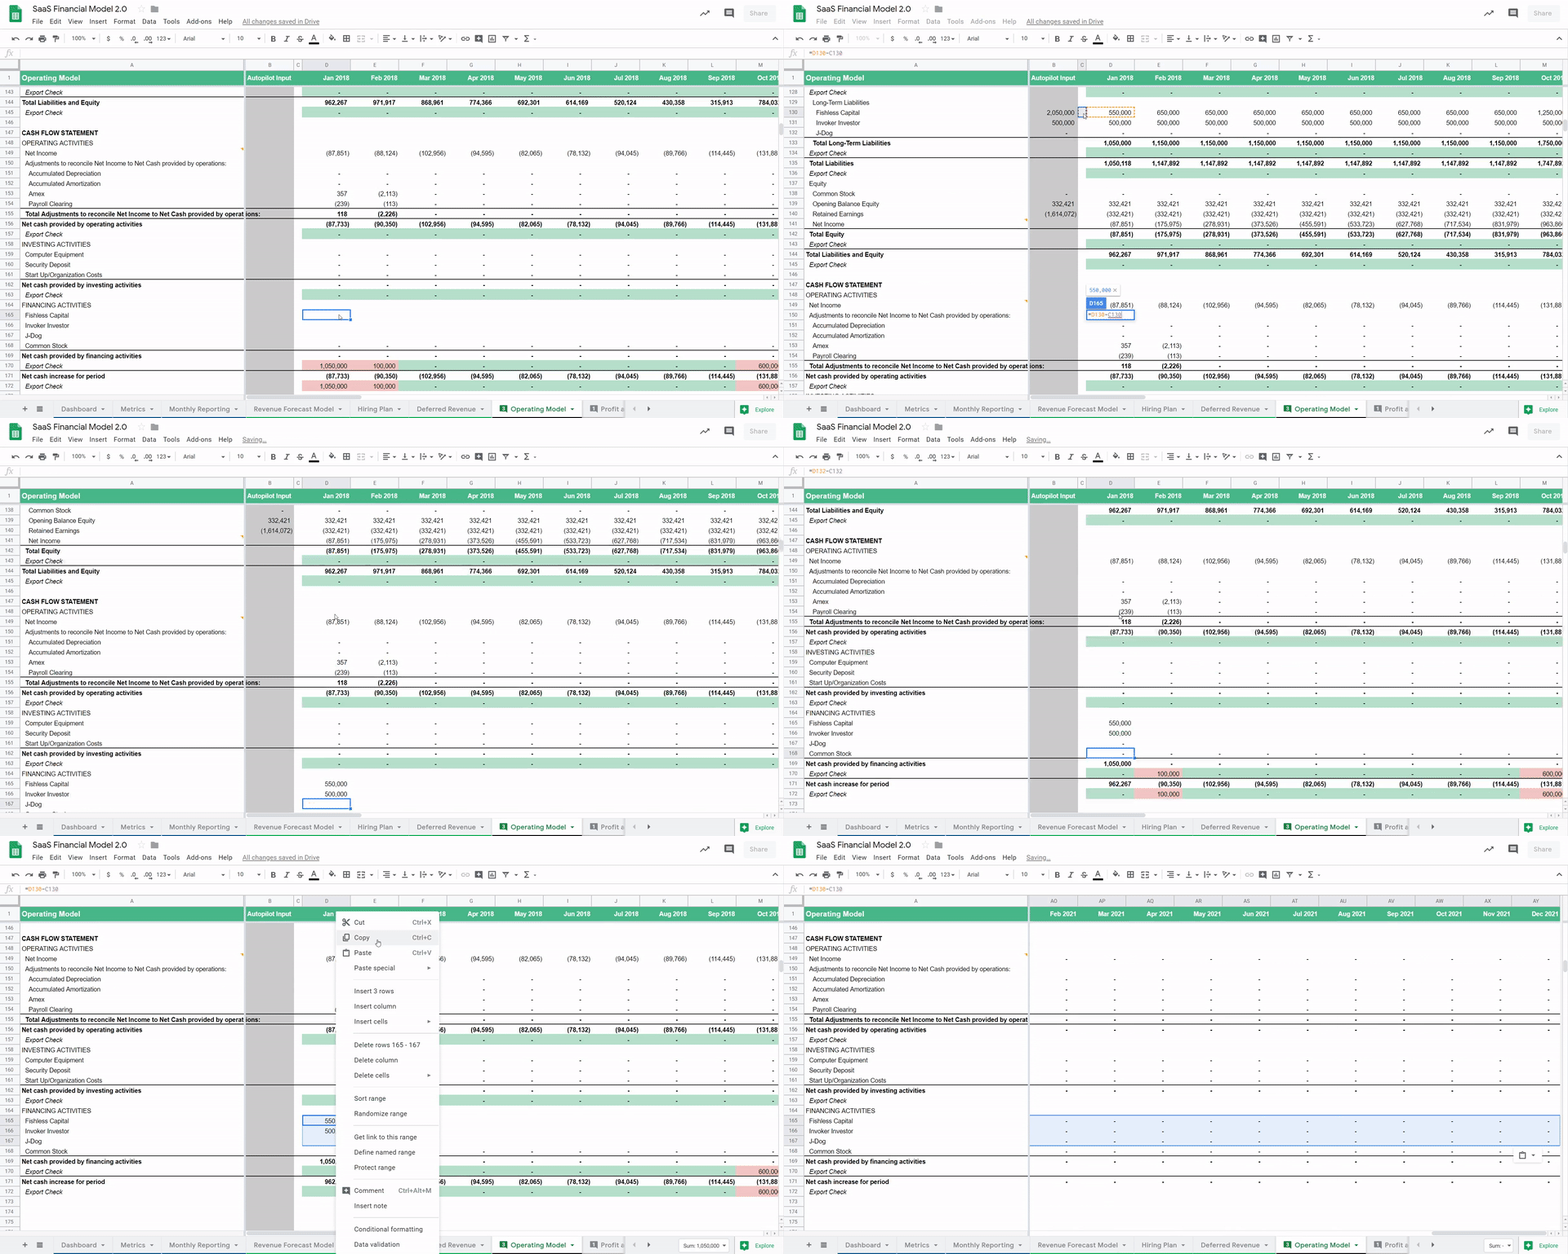
Build the cash flow statement from balance sheet
Finally, one last time-consuming part is to finalize the Cash Flow Statement (CFS). The good news is that this pays off in spades once you begin to forecast your cash—say, from annual prepays, loans, or investments.
The CFS doesn’t do anything on its own. It just looks at the differences in monthly values from your Balance Sheet and presents them in a separate statement.
An increase in Assets decreases the cash because you are buying something like a laptop. On the other hand, an increase in Liabilities — e.g. a loan —will also increase your cash. And vice versa.
Create first autopilot forecast
After the one-time initial setup, we can begin forecasting.
The first step is to create a forecast that’s just an average of your performance over the past three months. I call this “Autopilot,” since the forecast updates itself every month when new data comes in.
I like to use Autopilot Input column to automate the use of these averages. The column looks up the most recently closed month from the Dashboard – here, April 2020 – and looks back three months to calculate the desired average.

Before moving onto utilizing the more advanced Forecast Models like Revenue and Payroll, I usually make all forecasts in the Operating Model to reference the Autopilot Input column.
Profit and Loss
Start by making sure all your forecasts are pulling in values from the Autopilot Input column (Column B).
Next, override any changes where the simple Autopilot doesn’t make sense. You can use the Autopilot Input column for any changes where the forecasted value remains the same.

Or you can edit the values manually directly in the cells. I recommend you highlight all the manual edits you make directly in the cells to make it easier to spot hard-coded changes later on as you update the model. I tend to use blue and yellow highlights (the latter being the higher priority edit):

Finally, you could increase the accuracy of the Autopilot by making your Cost of Revenue (COR / COGS) section to be calculated as a percentage of revenue.
Because costs such as hosting scale alongside your revenue, using the modified Autopilot will improve the accuracy of your forecasts.

Note that Autopilot is a slightly different beast from the Last 4 Months (L4M) model, popularized by Jason Lemkin, in a sense that we don’t add any growth assumptions quite yet. While L4M can be really useful to look at as a separate scenario, Autopilot serves a different purpose: quickly building out the structure of your forward-looking financial model before diving deeper with custom forecasts.
Balance sheet
For Balance Sheet Autopilot, I recommend using the last month’s value to avoid adding any unnecessary noise to your cash forecast before we actually understand what are the drivers in your business. I modified the Autopilot Input formula to pull only the most recent month.
Cash flow statement
There is no Autopilot needed for the Cash Flow Statement since this is an automatic calculation. Make sure the formulas you create above extend to the forecasted months as well.
Forecast models
After implementing these Autopilot setups, you should have much better visibility which line-items deserve a custom take on their forecasts. For most businesses, this means their hiring plan and revenue.
We’re going to build examples for both.
1. Hiring plan
While you could continue to forecast your payroll spend as an average of the past few months, creating a Hiring Plan on an employee-by-employee level will increase the accuracy of your projections. This is where you’d benefit from bringing in someone from your leadership team to keep things up-to-date.
On the Hiring Plan tab, add each of your current team members with their salaries, benefits, and other information. If you have recurring contractors that act as an extension to your team, add those as well with a contractor status.
For better readability, I recommend adding Headings for each team, e.g. “Engineering” and “Marketing”.

Scroll down to the Teams section, and verify if the numbers make sense for the past few months. You don’t need to make the hiring plan accurate since the beginning of time, since the values from your accounting system will override data in the past.
Finally, we will pull the output rows of the Hiring Plan into the Operating Model. Each total is a named range, and they’re already being pulled into the Operating Model.
Note: There’s nothing preventing you from using Data Exports to pull employee data into the Hiring Plan, but in my experience, the time savings aren’t significant until you have 50+ employees and are constantly hiring.
Now all you need to do is go into the Operating Model and copy and paste the green hiring plan formulas under their respective payroll accounts. These formulas pull the salaries, benefits and payroll tax information from the Hiring Plan.
Pay careful attention to the formula name! If the named range says it’s pulling Hiring_Plan_Marketing _Salaries, it’ll only pull marketing salaries. Thus, you can’t use the same formula elsewhere and expect it to pull Sales Salaries.

That’s it for the Hiring Plan! With adding only one custom forecast to your financial model, you’ve markedly improved the accuracy of your expense forecast.
2. Revenue model
Revenue is generally the most important and the most difficult item to forecast in any business. To forecast effectively, we will first want to see what the history looks like.

3. Prepare data export tabs
To get started, we need data about your customers. The easiest way to see this is to pull a handful of reports from a SaaS metrics platform such as Baremetrics. You can also enter these manually, or use an export from your billing system.
Head over to Monthly Recurring Revenue in your Baremetrics dashboard.
First, select “All time” as the time period from the dropdown on the top right. The chart should automatically switch to display data by month.

Export both Graph and Breakout from the top right, and repeat for the following reports:
- Active Customers (both Graph and Breakout)
- Upgrades (just Graph)
- Downgrades (just Graph)
Copy and paste each of these into the MRR Export tab in the financial model. You can ignore copy-pasting the dates from all exports except the first one on left (MRR Breakout).

Six exports from Baremetrics, color-coded to denote where to paste each export
4. Fill in actuals
Next, you’ll need to tell the Revenue Model to retrieve it from the exports. I’ve named the columns in the data export template, so if you have exported the values from your subscription metrics tool, you can now navigate to the Revenue Model tab to copy the formulas across the time period you want to pull in.

Revenue Model formulas in green pull in the actuals for that row from the MRR Metrics data export tab (here: Baremetrics Export).
5. Create autopilots
Using an Autopilot forecast is a great way to get started. The example template pulls the number of new customers from a Marketing Funnel, but for now, replace it with something like a median for the past three months. ARPC (Average Revenue Per Customer) should be already set to an Autopilot using Weighted Average.

The company has been getting 14-28 new customers a month at an average size of $1,239/mo each. The Autopilot continues to project out 20 customers each month, bringing in $24,773 in New MRR. While this obviously needs to change to something more accurate, you’ll immediately get an idea what is the baseline to beat.
Next, use Autopilot to project out your expansion, contraction and churn. As you sum these with the new customer MRR, you end up with Net New MRR for the month.
Add the Net New MRR to your previous month’s Monthly Recurring Revenue, and you have your revenue forecast for the month.

Finally, we need to take the revenue forecast and make sure it’s reflected in the Operating Model. Similar to the Hiring Plan, the yellow MRR row is the output we want to pull in. The row is named Revenue_Model_MRR.
Navigate to the Operating Model tab, and make sure the formula is pulling values from the Revenue Forecast Model.

6. Create a marketing funnel
The biggest remaining flaw in your Autopilot forecast is that your new customers are coming in at a flat rate, when you’d likely want to see growth.
In this example, we’re improving this forecast by bringing in our imaginary Chief Marketing Office (CMO). They own the process of tracking the conversions from visitors to leads to paid customers, and have the best insights as to what the future might look like from a marketing perspective.
Since we are talking about the future, this would normally mean adding another Forecast Model.
This time, the marketing funnel lives in another workbook updated by your marketing leader, which means we will need just another data export to pull in the outputs in.
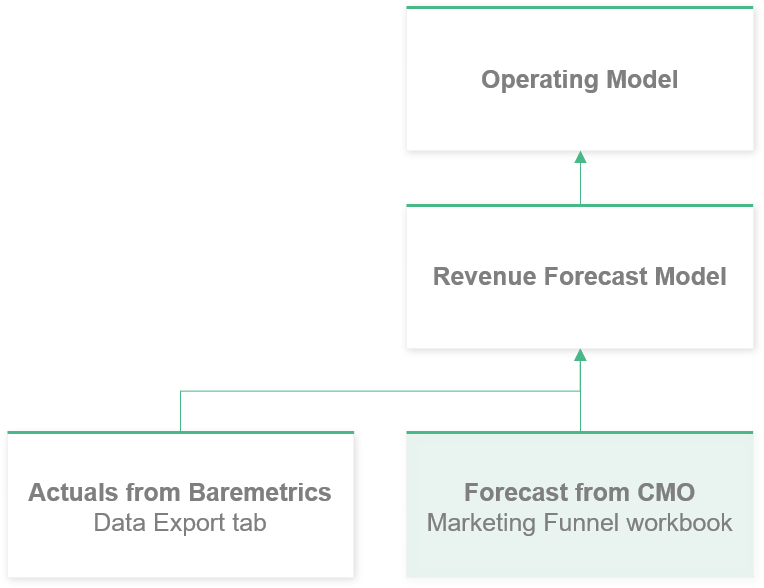
Here’s the example SaaS marketing funnel template. Again, create a copy of the template to follow along.
The funnel we are building is simple. Visitors to the site come from two sources:
- Paid advertising
- Organic search.
Paid ads are driven by the spend in a given marketing channel, whereas organic traffic is expected to grow as a result of content marketing efforts.
Start by pulling in the Google Ads spend into the AdWords tab of the Marketing Funnel.
Copy and Paste the SaaS Financial Model URL into this section, and define from which row you want to pull data from. Given you have created copies of both templates, you’ll have to update this URL and make sure the Google Ads Range matches yours.
Next, modify the template to fit your needs. Enter how many visitors convert to leads, to marketing qualified leads and ultimately, to new customers.
The numbers with a white background are a formula, and the advertising spend in green is pulled from your Operating Model. You can edit any future values with a blue background. I have included some weighted average calculations to give you a faster start.

For modeling purposes, it’s the new customers we are ultimately interested in, but having the steps in between enables us to move away from an educated guess to a more systematic projection.
On the tab of Marketing Funnel – Summary, we can see how new customers are summed up from paid and organic sources, only to be pulled into the tab with the same name in the master financial model.
Although you could copy and paste this section into the master model and pretend it’s an export, I recommend using the IMPORTRANGE formula to bring over the summary automatically.
You should now have an idea of how to add in additional forecast models to your financial model, and have your respective team leads own them.
Note 1: If you don’t need the marketing funnel living in a separate workbook, you can just copy-paste both the Organic and Adwords tabs into the financial model. All you need to do is to change the Marketing Funnel – Summary to reference these newly created tabs.
Note 2: This example is for marketing-driven companies. If you are sales-driven one, you may want to add an entirely new revenue forecast model to pull data from your existing sales pipeline
7. Forecasting cash from annual plans
Most of our SaaS clients have mix of customers paying either monthly or annually.
One of the biggest reasons prospective clients reach out to us is to better understand the cash impact of their annual plans. This makes sense, because the cash coming in from annual prepayments is particularly challenging to forecast, and yet prepayments can be critical in funding their growth.
In this post, we are going to look what would happen if Southeast Inc were to introduce an annual billing option. In other words, we ignore existing customers for now.
First, we want the Revenue Model to split new customers into monthly and annual customers.

So far, Southeast’s customers have been paying on a monthly basis. Therefore, the Net Income and Net Cash Increase / Decrease are nearly identical. (In practice, you’d have some small differences due to pending payroll taxes or credit card balances to be paid off.)
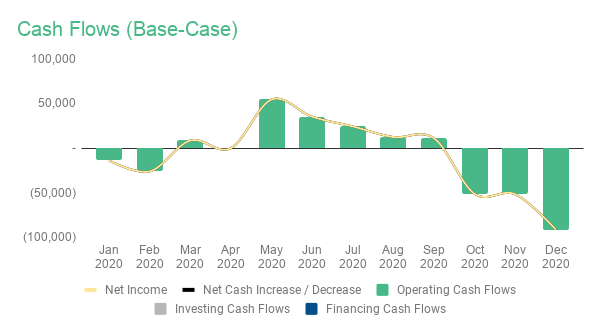
Before introducing annual plans, the company’s Net Income andNet Cash Increase / Decrease are nearly identical.
As you can see from the chart below, having 30% of your new customers pay annually would significantly increase your cash coming in. Now you can actually see the black line in the chart.
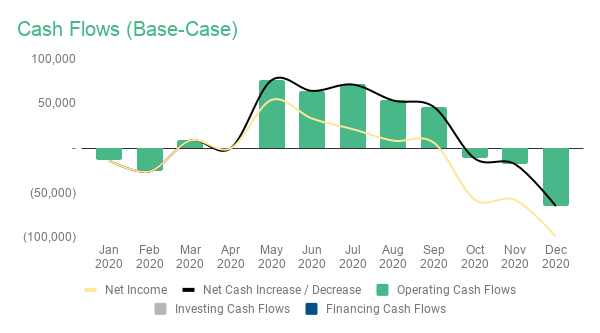
After introducing annual plans, the company’sNet Cash Increase goes up significantly.
Note: I am going to leave the estimated percentage of new customers paying annually at 0% in the published template. Given the impact to your cash balance is so significant, I want you to consider the % very carefully before introducing it as a part of your forecast.
Don’t create a homegrown cash forecast
Many companies I’ve seen attempt some sort of of internal, custom calculation for figuring out the cash impact on their business. This is like re-inventing the wheel – and the resulting wheel is probably not even round.
The standard and widely-understood method for forecasting cash from annual payments is to forecast Deferred Revenue.
The challenge is that I have never met a CEO or a founder who “gets” the deferred revenue upon first walk-through. This isn’t to say startup finance folks are some kind of geniuses, far from it, but rather to highlight that there are many moving pieces you need to keep tabs on.

First, forget debits and credits, and let’s remind ourselves what we know already:
- We know our what our revenue forecast is since we just built it
- After introducing annual plans, revenue will not equal the amount of cash coming in each month.

Revenue and Cash coming in begin to differ from May onward after introducing annual plans
To get to cash, we should think of it as making adjustments to the revenue each month.
Cash impact of new customers – Adjustment example
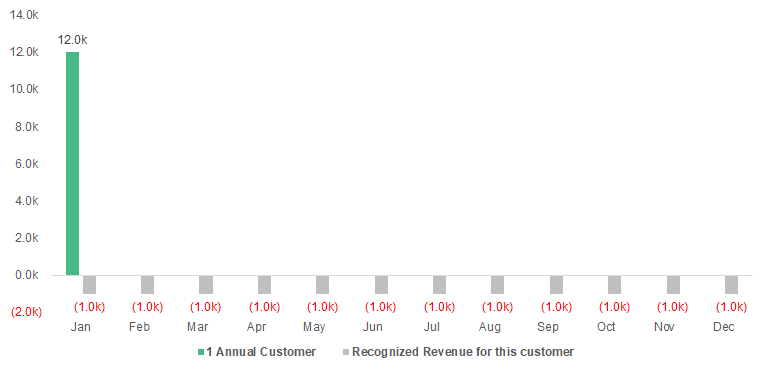
Let’s use a super simple example where a customer signs up for a $12,000 prepaid, annual plan on January 1st. There are no other customers, renewals, or any other activity at the company. Not even expenses.
Now, that $12,000 is not actually revenue – it’s just a prepayment. You can figure out your monthly revenue by dividing the prepayment by the number of months in the contract. Just like MRR.
To put it differently, recognize the payment over the service period, which conveniently for us, is a calendar year. (Ignore daily recognition for now).

As a reminder, we want to figure out what is the adjustment to revenue we need to make that gives us the cash impact on the business.
Given this is an example with only one customer, we already know the outcome—the $12,000 cash coming in. But repeated across hundreds or thousands of customers, we have no idea what the outcome would be unless we have iron-tight understanding of what the adjustment process should look like.

To create the adjustments, we need to figure out what’s our Deferred Revenue balance on the Balance Sheet. Every new customer prepayment adds to the deferred revenue balance, whereas the balance gets reduced as revenue is earned or “recognized” over time.
Here’s what the additions and deductions would look like for the same customer signing up in January:
Still, while we now begin to understand how this works in theory, the balance sheet will only accept this in one format only: a balance.
So we’ll sum up all of these additions and subtractions to get to the month-end balance of Deferred Revenue:

The thing is, the monthly difference in the Deferred Revenue balance is the adjustment we are looking for. Given that this company had no previous deferred revenue, the first month’s difference is $11,000 minus the previous month’s balance (zero) which equals $11,000.
For the following month, the equation is $10,000 minus $11,000, which equals a negative ($1,000).
If we now sum Revenue ($1,000) and Deferred Revenue Adjustment ($11,000), we will finally understand what is the cash impact. $12,000 the first month, and no cash coming in thereafter.

The problem is that the cash impact isn’t directly visible anywhere in your books, and that’s where most confusion with CEOs/Founders seems to arise.
The main difference is that your accounting will first deduct Costs and Expenses from your Revenue, resulting in Net Income. Only after you get to Net Income, it is then adjusted with Deferred Revenue.
And to make things more difficult, it is also adjusted with everything else from Accounts Receivable to paying off credit cards. The end result is Net Cash Increase, which is the amount that gets added to (or deducted from) your bank every month.
Given the super simple example company has no other activity or expenses whatsoever, the outcome would still be the same:

Adjustment – Southeast Inc
The good news is that as long as you actively project our future revenue in the Revenue Forecast Model, the financial model template will automatically calculate the Deferred Revenue adjustment for you.
Your labor with the Cash Flow Statement will also come to fruition, since it will automatically calculate the adjustments for us from the balance sheet Deferred Revenue balance differences.

When you think about it, your Operating Model is actually a huge adjustment table. You have Revenue at the top, followed by all sorts of expenses and balance sheet changes, resulting in the Net Cash Increase/Decrease at the very bottom.
Keep in mind this is still a simplified example, as Southeast Inc. is only beginning to sell annual plans – they don’t have any renewals or existing annual customers to worry about. Ping me on Twitter or add a comment in the model and I’ll attempt to clarify.
Loans & Investments
Many of our larger bootstrapped customers have taken out loans in the past to invest in their growth, or to maintain a larger cash cushion just in case. A loan is typically hard to obtain for an early stage startup, but once you begin to generate profit, they can be a cheap source of leverage for your business. Before moving forward, I’d recommend getting proper consultation first.
Given the many government relief packages in the United States and elsewhere, I have included two types of loan forecast models.
PPP Loan or Partially Forgivable Loan
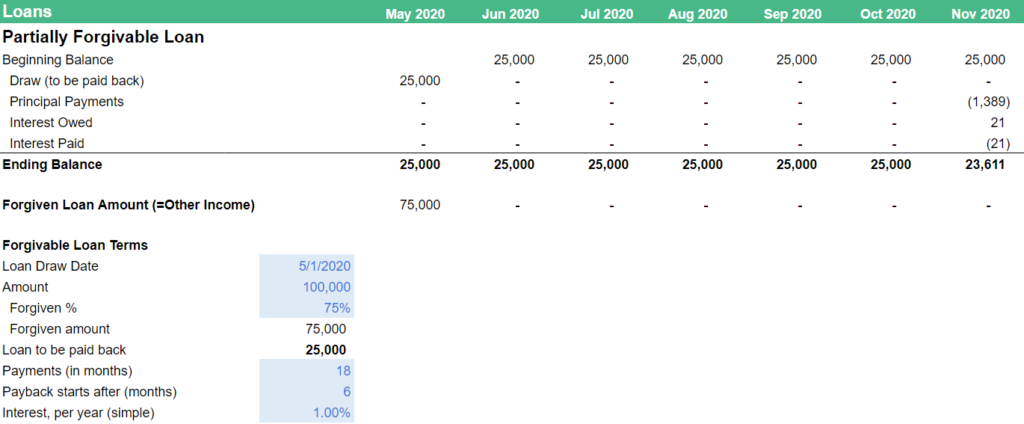
The first one is a partially forgivable loan where a part of the loan doesn’t have to be paid back. The example here follows the Paycheck Protection Program Loan offered here in the U.S., but you should be able to substitute the values with what your government or bank offers.
You can begin filling in the Loan Terms highlighted in blue, and the loan forecast will fill in automatically. I’m using the BASE format in forecasting the balance sheet balance, which stands for:
- (B) Beginning Balance – last month’s ending value
- (A) Add balance to be added, such as the loan draw
- (S) Subtract the amount(s) taken out of the loan balance, such as the principal repayment
- (E) Ending Balance. This is a sum of B + A + E, and feeds into the Balance Sheet on the Operating Model
Regular loan (or an investment)
If a forgivable loan isn’t an option for you, you might want to look into a regular loan. This could be a loan from the Small Business Administration, or from a bank.
You can also use this forecast model as for investments such as convertible notes – just clear out the rows with principal and interest payments.
While the calculator will technically work for SAFEs and priced rounds as well, you might want to make the output to flow into the Equity section of the Balance Sheet.

Scenarios
Building scenarios is a way to look into multiple possible futures for your company. Most of our customers tend to look at 2-3 scenarios:
- Target, or Optimistic scenario. This is where everyone in your team is trying to get to.
- Base-Case. Slightly conservative forecast that your leadership should believe you can handily beat. Sometimes Base-Case mirrors the average performance of your past three months, which means it can be fairly accurate for the next few months, after which it’s likely to understate your growth. You can also combined Base-Case and Target, where the next few months project your average performance, after which the growth picks up.
- Fallback or Worst-Case. This scenario is for the most paranoid of us, as it helps you figure out what to do if everything goes wrong. If there’s even the slightest possibility that the coronavirus wipes out 30% of your revenue, this is the scenario you use to plan for it.
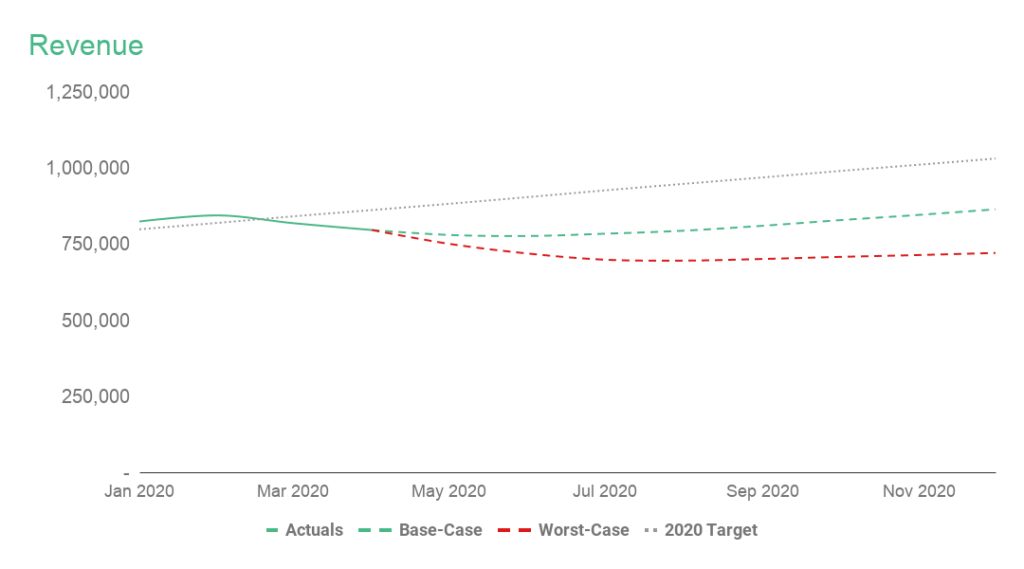
Given how cumbersome it is to manage multiple scenarios in a spreadsheet, I have gone with two active scenarios, while preserving your previous 2020 Target for comparison purposes.
Preserve a copy of your old forecast
Expect that your old target for 2020 is no longer relevant. However, it is going to be useful to compare against as we start building a more realistic outlook.
Create tab named Operating Model – 2020 Target, and copy and paste values and formatting from your current, not-yet-edited Operating Model.
We are going to use this hard-coded snapshot of your old forecast in our next section about Budget to Actuals.
Create worst-case scenario
Start by creating carbon copies of your Operating Model, Hiring Plan and Revenue Model. Instead of duplicating each tab, select the tab contents and copy over the formulas, and then the formatting by using paste special. I recommend you add “Worst-Case” at the end of each tab name so you quickly know what you are looking at.
Similarly to the previous step with 2020 Target, go ahead and add named ranges for each of the tabs:
- Oper_Model_Revenue -> Oper_Model_Revenue_Worst_Case
- Revenue_Model_MRR -> Revenue_Model_MRR_Worst_Case
- etc.
What’s different from the previous step is that you’ll need to also connect these newly created modules to the Operating Model, Worst-Case tab.
The good news is that all you need to do is to add _Worst_Case at the each of each account where the forecast is pulled from either the Revenue Model or Hiring Plan.

Now is the time to start editing this scenario. The way I see it, the purpose of the Worst-Case scenario is to figure out what to do if everything goes wrong.
You’re already familiar with editing the each of the forecast models and the Operating Model – all you need to do is to figure out the inputs in your Worst-Case scenario and enter those in.
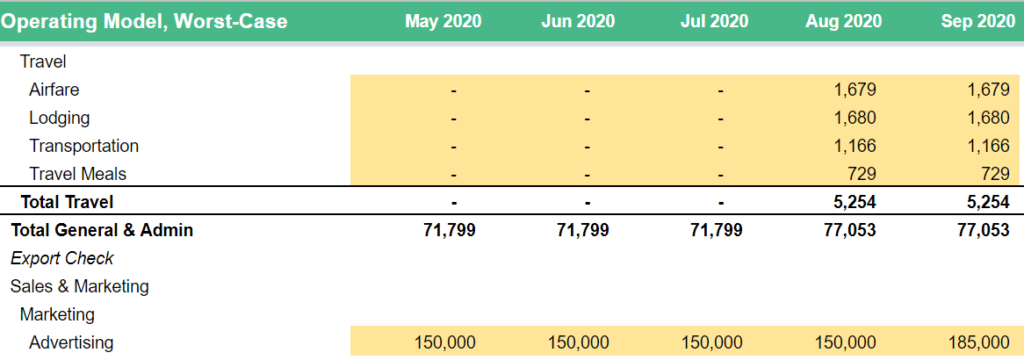
I’ve included some example edits in the Operating Model, Worst-Case (highlighted in yellow). Although your main changes should happen on the Revenue Model and Hiring Plan tabs, there are some changes you probably should make directly on the Operating Model.
If you want more detail as to what should go into building a worst-case scenario, check out my post How to to Build a Worst-Case Scenario Using a SaaS Financial Model.
Repurpose your ongoing forecast as the Base-Case
To avoid confusion between scenarios, I recommend you append “Base-Case” at the end of your existing Operating Model, Hiring Plan and Revenue Model tab names.
If you are building more than two scenarios, you could rename the named ranges to include _Base_Case at the end. For two scenarios I don’t think it’s worth the effort.

Budget to actuals (forecast vs actuals)
How to compare forecasts to actuals
Comparing your actual performance against your previous projections is a great way to iterate and improve your forecasts.
Note that I’m talking about forecasts in plural – this is not a one-off exercise where you compare your actuals against a stale budget from a year ago.
Instead, you should compare your performance against every single monthly forecast you have created over the past months.
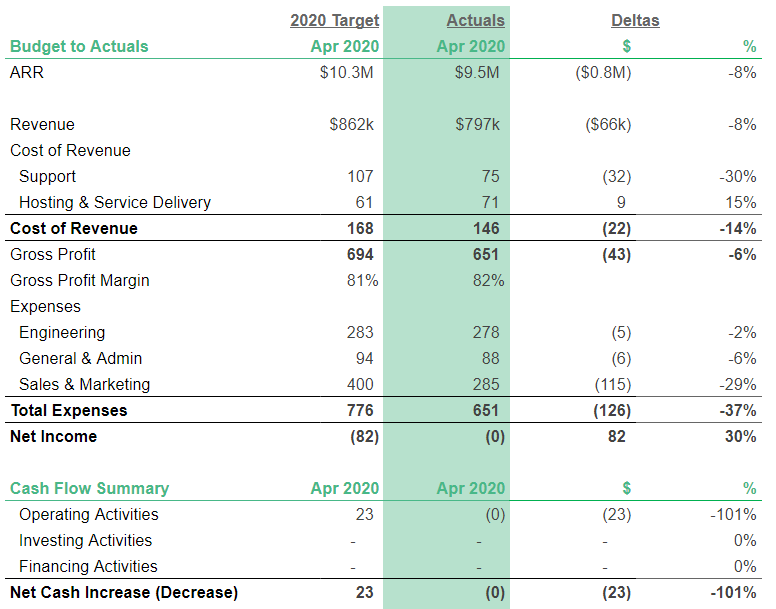
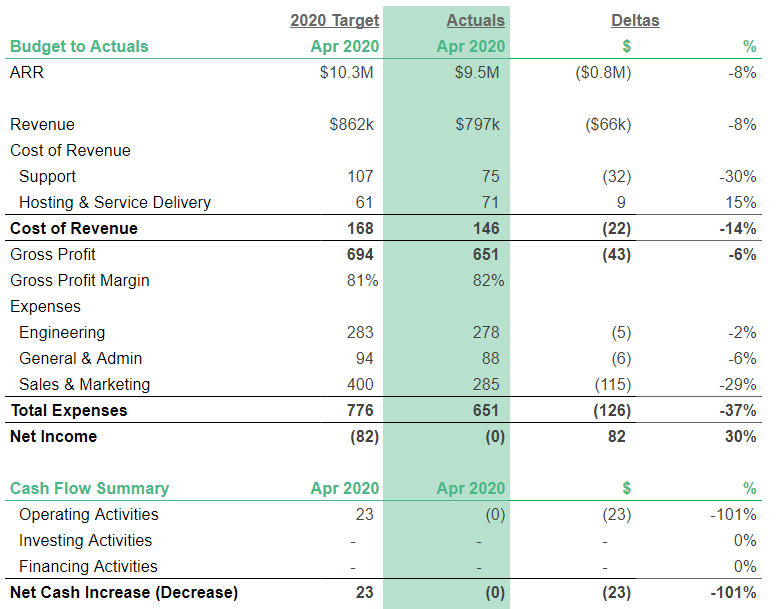
Example of comparing your actual April performance vs the 2020 Target.
When you create your first few snapshots of your previous monthly forecasts, you’ll catch errors such as expenses you forgot to forecast in the first place. Later on, the performance comparison will help you focus your attention on the areas of your business that matter most.
If your accounting fees were off by 1% or even 5%, it doesn’t matter all that much. Now, say that your recurring revenue is right on target but your new trials are lagging 10% behind vs your projections from a month earlier. This is not only a leading indicator of missing next month’s revenue goal, but also can point you out to the right direction where your team might need additional support.
Access snapshots of previous forecasts
In order to access our hard-coded, former forecasts, we need to add Named Ranges to the 2020 Target – Operating Model tab. I recommend you use a syntax where you add the tab name at the end of your previously used named range. This makes it trivial to pull in the desired values on the reporting tab.
Add the following ranges (or more if you want to pull other items to the Dashboard / Reports tabs):
- Oper_Model_Revenue_2020_Target
- Oper_Model_Support_2020_Target
- Oper_Model_Service_Delivery
- Oper_Model_Engineering
- Oper_Model_General
- Oper_Model_Sales_and_Marketing
- Oper_Model_Bank_Accounts
Next, we are going to access these former forecasts in the Reporting Models section.
Want to Reduce Your Churn?
Baremetrics measures churn, LTV and other critical business metrics that help them retain more customers. Want to try it for yourself?
Reporting models
As the name suggests, Reporting Models pull data from elsewhere in your model and present it in a more digestible format. The goal is to create summary tabs that give you a high-level overview of what’s happening with the business, enabling you to do deeper dives on areas that require attention.
Here’s what we will build:
- Dashboard. This is the place you you need to review each month. Include only the most important metrics and numbers for your business to avoid information overload.
- Reports. A deeper dive, but still in a summarized format. I recommend you use this area to get visibility to your budget to actual comparison, and for comparing your scenarios to each other. It’s also useful for looking at your longer term forecast.
- Metrics. Very similar to the Reports tab, but with a focus specifically on SaaS metrics. You want to see many of these metrics like CAC and LTV in the right context and see how they compare to each other, for which I have found it useful to create a separate tab for them.
You could even create a reporting tab specific to your team or investors, and share that on a separate workbook using the IMPORTRANGE functionality we discussed earlier.
Dashboard
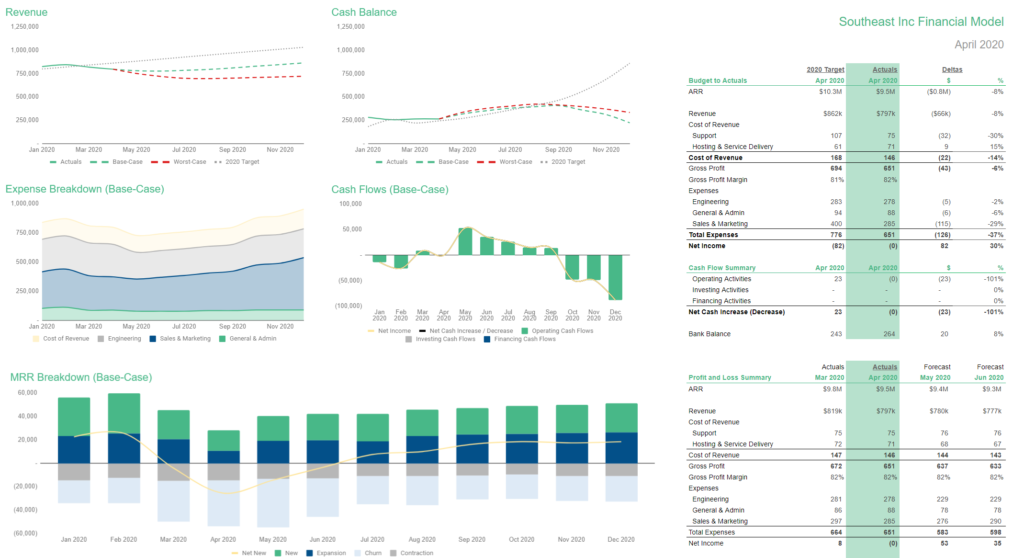
Financial model dashboard is a great place to review the most important areas of your business on a monthly basis.
The goal is to include several high-level tables and charts, which enable you to highlight the areas where you need to do deeper dives into the drivers of your business. It will also help you spot any potential problems.
Here’s an example of a dashboard view:
Start with financials summary
Personally, I prefer starting my monthly review by looking at a financial summary table such as this. It’s up to you if you want to look at last month’s performance vs actuals, or whether you want to have a few months’ summary like we had in the previous version of the model. Larger companies often use a quarterly view instead of monthly.

Profit and Loss doesn’t tell you the impact on your bank account, for which it’s useful to include a summary of the Cash Flow Statement and the Bank Balance.
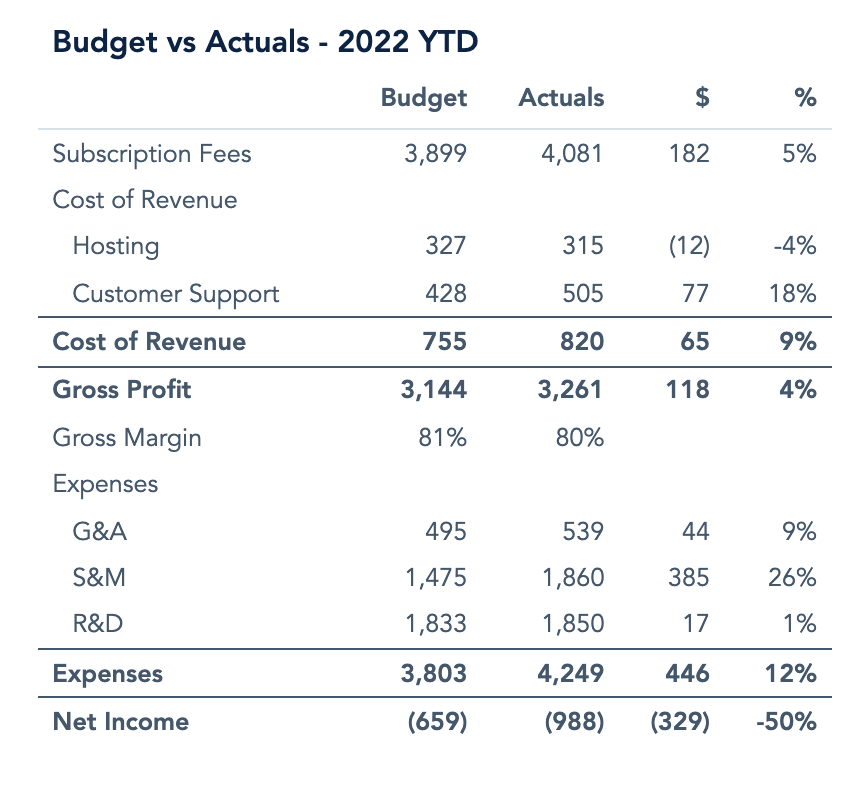
The actual retrieving of the data is easy: The Actuals column will pull data from your current Operating Model – Base-Case tab, whereas the 2020 Target uses the Operating Model – 2020 Target. Like this:

Select other charts & tables
Next, decide which charts you want to look at. I highly recommend you include at least the revenue forecast and bank balance projections:
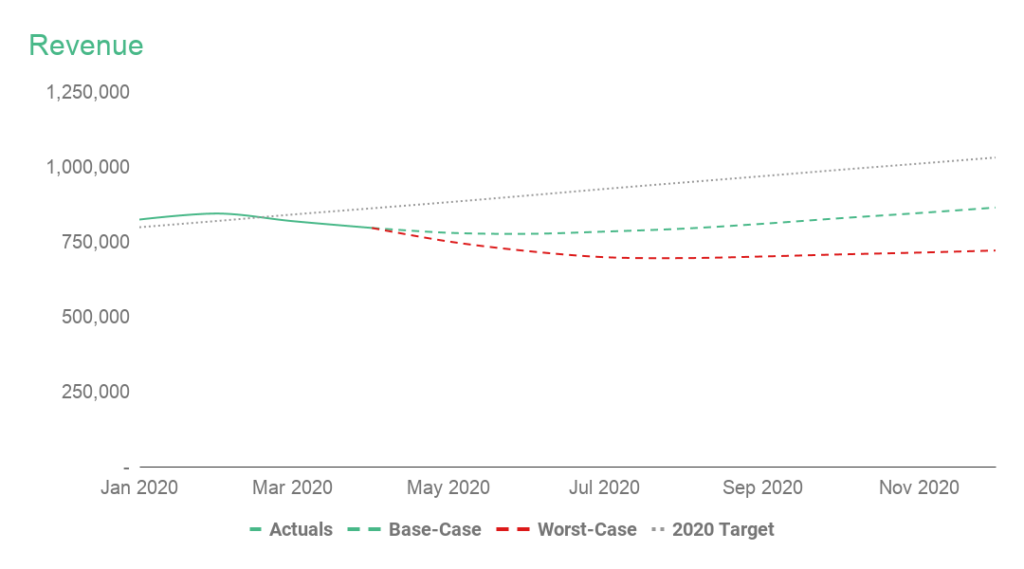
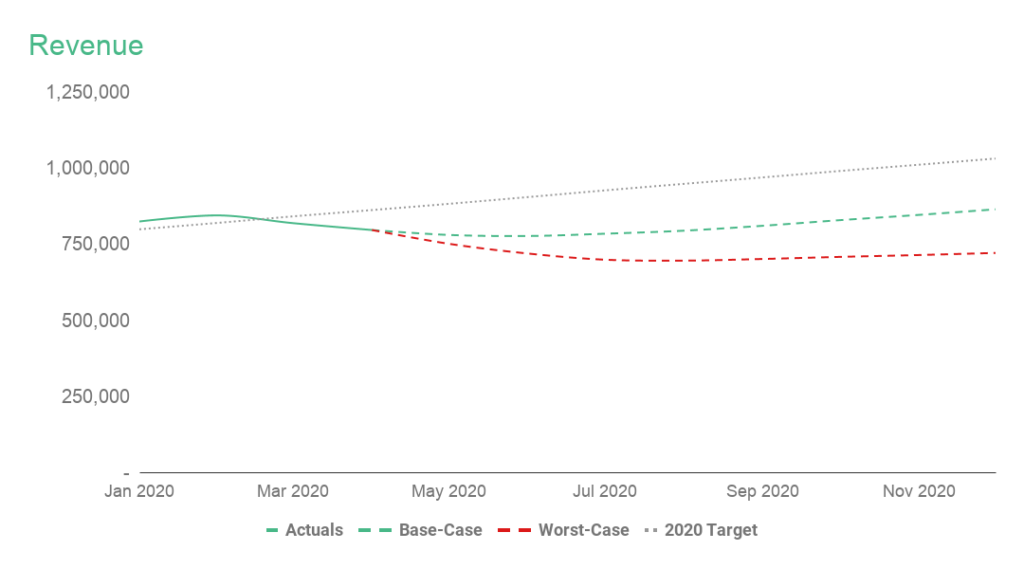
Current Revenue forecasts for Base-Case and Worst-Case scenarios. Also plotted: previous 2020 Target.
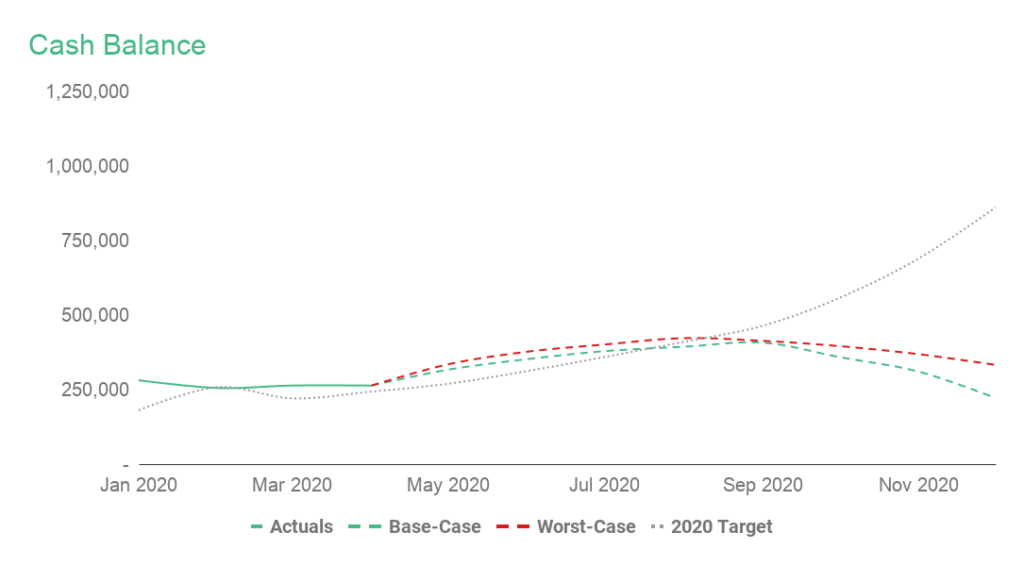
Current Bank Balance forecasts for Base-Case and Worst-Case scenarios. Also plotted: previous 2020 Target.
The rest is up to you. I have included charts for Cost & Expense breakdown and Cash Flows, but you could also bring in relevant tables from the Reports or Metrics tabs introduced in the next chapter.
Utilize chartbuilding tab for easy updates & custom charts
While you could pull the dashboard charts directly from the other tabs, I recommend creating another reporting model called Chartbuilding.
This makes it easy to quickly create and update charts, without having to worry about something breaking in the model. Conversely, you can also freely add rows and columns in the forecasting models without having to worry about the dashboard breaking.
Utilizing Chartbuilding tab will also let you create custom charts such as the Revenue chart with solid line for actuals and dotted line for forecasts.
Create named ranges for the data you want to look at, and pull them into the Chartbuilding tab. This could be metrics, revenue or accounts from the Operating Model—anything at all that lives inside your financial model.
For example, name your total bank accounts like this:
- Base-Case: Oper_Model_Bank_Accounts
- Worst-Case: Oper_Model_Bank_Accounts_Worst_Case
- 2020_Target: Oper_Model_Bank_Accounts_2020_Target
Next, pull these figures to the Chartbuilding tab. All you need to do now to create a good-looking chart is to select the area, and format each series. (Say, for dotted-line forecasts.)

Reports
You’ll want to organize this area so that the most important tables stay on top, and you’ll scroll down to make deeper dives into the data. Keep in mind you can and should change this order, once your needs change.
Case in point: We just introduced new scenarios, and it’s important we understand what is changing vs your former 2020 goal.
Before comparing the scenarios to each other, I want to first familiarize myself with the 2020 former target as it relates to 2019.

It looks like:
- Revenues increase by 40%
- Gross Profit increases by 40%
- Expenses grow only 20%, mostly driven by Sales & Marketing
- The company makes a $229k loss
- Bank balance grows by $566k due to introducing prepaid annual plans

Now, to better understand and improve your new Base-Case and Worst-Case scenarios, you can look at the same high-level metrics.
- Revenues increase is only between 15% (Worst) and 25% (Base)
- Gross Profit increases by 17-26%
- Expenses change from -3% decrease to 6% increase
- The company profitability varies from a small $73k loss to $38k Net Profit
- Bank balance change equals Net Income
Even the initial high-level review reveals that there’s still work to do with the scenarios.
Is it likely that the Worst-Case scenario still achieves 15% annual revenue growth while cutting costs – particularly engineering?
And how is it that hosting costs increase by almost 30% if the revenue growth is only half that? Finally, what happened to the annual plans?
Do both scenarios assume selling annual plans is no longer an option – especially since now those would be more helpful than ever?
I’ve included several other examples to give you better visibility what’s happening in your business. Take a look at the quarterly view and how your revenues, expenses and bank balance change over time.
The percentage of revenue tables are another way for you to normalize the numbers and compare the scenarios between each other.
Use Reports to sanity check long-term forecasting
In building this template I have focused on the next 12 months only, but here are couple of pointers how you can start building and sanity checking your longer term forecasts.
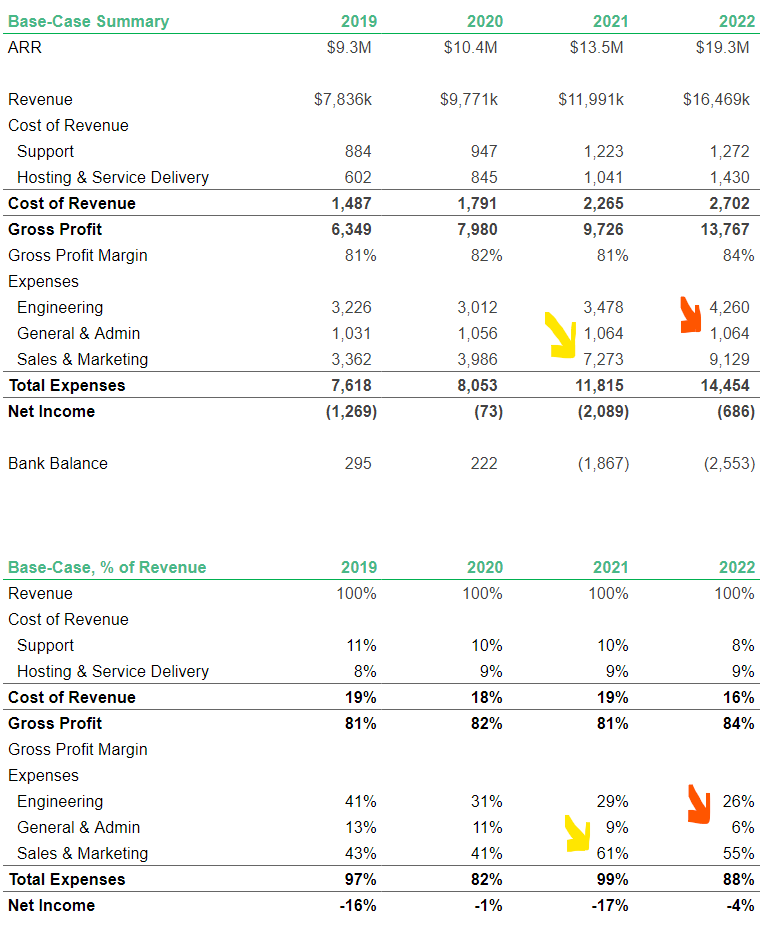
Below, you can see that although you plan to become near-profitable in 2020, your capital requirements for 2021 would be about $2 million! Either you need to decide if your investment to Sales & Marketing is too high, or figure out how you fund this growth.
I’d also review if investments in the other areas of your business are sufficient to sustain your targeted growth. Your R&D spend might be within possibility, but your General & Admin spend is definitely too low by 2021.
Follow this process as you iterate on your long-term forecasts, and come back to check on the Reports and Metrics tabs how your changes affect your business.
Check in on SaaS Metrics
I like to think of metrics as sanity checks on the sustainability of the business.
Is my Customer Lifetime Value (LTV) high enough compared to my Customer Acquisition Cost (CAC) to continue investing in Sales & Marketing?
If not, what needs to change? Or if I’m making 80% gross margins right now, but the forecast says it’s decreasing to 70% in six months, do I understand why?
Forget benchmarks against “average startups”
In contrast, I’m not a huge fan of using metrics to benchmark your company against the average startup.
I often get asked questions along the lines of “What’s a good CAC payback time?” and my go-to response is the ever-boring “it depends.” For this specific question, it depends on the company’s capital position and appetite for risk.
A VC-funded, well-capitalized startup selling large, prepaid contracts might be comfortable with 12-18 month payback times. On the other hand, a bootstrapped, profitable company selling monthly plans can’t wait that long without a massive cash cushion.
In this example template, we’re pulling data from the Revenue Forecast Model and the Operating Model to calculate some of the most common SaaS metrics.
Customer Acquisition Cost
Let’s begin with Customer Acquisition Cost, or CAC.
First, pull your total Sales & Marketing expenses from your Operating Model, and the number of new customers per month from your Revenue Forecast Model. The named ranges for each are:
- Oper_Model_Sales_and_Marketing
- Revenue_Model_New_Count_1m + Revenue_Model_New_Count_12m (if you have annual plans)

Now, this is just the company-wide or “Blended” CAC. While useful, given that paid acquisition is a large part of the Southeast Inc’s marketing strategy, we’ll also want to calculate another metric: a Paid CAC (or CAC per Marketing Channel).
We know the breakdown of new customers from paid and organic sources. Thus, we can pull your Advertising (=AdWords Spend) account from the Operating Model, and pull new customers originating from Google Ads from your Marketing Funnel.

Customer Lifetime Value
Next, let’s calculate the customer Lifetime Value (LTV). This is calculated by multiplying gross-margin adjusted Average Revenue Per Customer (ARPC or ARPU) by the expected customer lifetime.
A common mistake is to use just the revenue-based figures and ignore the gross margin. I don’t recommend such an approach, as the result is something between overstating the strength of your metrics and lying to yourself.
To make the adjustment, we’ll first need to calculate the gross margin. Pull your Revenue and Cost of Revenue from the Operating Model, and divide the second value by the first. That’s your gross margin for each month. For SaaS businesses, this is usually between 70-90%.
Next, pull the number of customers from the Revenue Forecast Model. Divide Revenue by the number of Customers to get to ARPC. Now, multiply ARPC by the Gross Margin, and you have your gross-margin adjusted figure!

Finally, pull in your customer churn (logo churn). Calculate the customer churn % by dividing the current month’s customer churn by the previous month’s total customers. The expected lifetime is often estimated as 1/churn, which is what we’re going to use here.
Now we have all the elements we need to calculate the LTV. You can even add the CAC to LTV ratio at the bottom.

While you could leave it here, I would also recommend creating quarterly views for all of these metrics. Your business goes through ups and downs each month, and monthly metrics aren’t always the best representation of the overall state of your business. Or at least the monthly view shouldn’t be the only one.
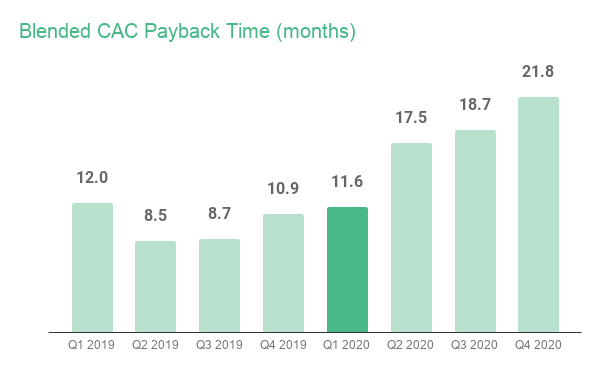
For example, CAC Payback appear to vary between 6 and 15 months in 2019. Quarterly view smooths out these variations, and yet provides enough detail for you to find trends in the data.
Gotchas
The biggest gotcha in repurposing the SaaS Financial Model 3.0 to your needs are the named ranges. While named ranges bring much-needed clarity into your formulas describing in plain English where your data is coming from, this requires setting them up correctly.
If you follow the instructions in setting up your Operating Model, most of your “totals” such as Oper_Model_Revenue will keep your named ranges intact and usable elsewhere in the model. O
On the other hand, the ranges that are located arbitrarily in your books will cause problems if not re-oriented to their correct location. Notably, Oper_Model_Advertising will need to be told its’ new location once you have updated the Operating Model with your data.
That said, whether or not you use named ranges, any multi-tab financial model will require you to verify the accuracy of the data you’re pulling in. The way I look at it is that it’s much easier to reference a row named Hiring_Plan_Engineering_Salaries vs trying to decipher what is it I’m pulling in from the Hiring Plan row 69.
Takeaway
The goal of updating your SaaS financial model on a monthly basis is to give you the tools you need to make operational decisions about your company.
You should be able to able to answer questions like:
- How are we performing against our Target scenario?
- What are our capital requirements until we become cash flow positive?
- How is my paid advertising driving my top-line growth?
- We missed our revenue target last month. Why is that, and what we need to change to get back on track?
Building a comprehensive, operationally-focused financial model requires a lot of work to set up, but the benefits are critical to grow your business, and are absolutely worth the effort.
That’s why Baremetrics Forecast+ is an essential tool for growing SaaS companies.
To start modeling your finances and effectively operate your business, import your bookkeeping and accounting into Baremetrics Forecast+. Get accounting and business metrics all in one place.
