Table of Contents

Mixpanel and Amplitude are product analytics platforms. They tell you what people do inside your product. Baremetrics is a subscription revenue analytics platform. It tells you what is happening to your money.
That sounds like a small distinction until you are the person who has to answer a question the tool cannot answer. It usually goes one of two ways:
- You have Amplitude instrumented beautifully, your board asks for net revenue retention, and you realize the tool has no idea what anyone pays you
- You are looking at Stripe, you know your MRR, and you have no idea which onboarding step people abandon
Both are real problems. Neither tool solves the other one. And the most common expensive mistake in this category is buying one and expecting it to cover both.
We're the team behind Baremetrics, so the section about us is clearly marked, but the honest answer for a lot of teams is "both," and we have written it that way.
💬 CTA: If your question is about revenue — MRR movement, churn, cohort retention, LTV, runway — Baremetrics connects to Stripe in minutes and answers it without instrumenting a single event. Start a free trial or book a walkthrough.
What's the difference between product analytics and revenue analytics?
They read different source data, and that determines everything else.
Product analytics reads events. Your application sends a stream of things users did: signed up, clicked, viewed, or completed. Mixpanel and Amplitude ingest that stream and let you build funnels, retention curves, and behavioral cohorts on top of it. The unit of analysis is a user and an action.
Revenue analytics reads your billing system. Baremetrics connects to Stripe, Braintree, Chargebee, Recurly, Google Play and Apple app stores, or a custom source via API, and reads subscription objects, such as plans, charges, upgrades, downgrades, cancellations, and refunds. The unit of analysis is a subscription and a dollar.
Two consequences follow:
Your product analytics tool does not know what anyone pays you. Not unless you send it that information as event properties. Then you'd have to keep it in sync as plans change, and handle proration, refunds, currency conversion, and mid-cycle upgrades yourself. (We talked about this at length when weighing the cost of building your own SaaS metrics dashboard with AI as well.)
Your revenue analytics tool does not know what anyone did in your product. Baremetrics can tell you a customer downgraded. It cannot tell you they stopped using the feature that justified the higher tier six weeks earlier.
Mature SaaS teams generally run one of each and connect them at the customer record. That is not a cop-out answer, but rather, what the tooling is designed for.
Can you get MRR and churn out of Mixpanel or Amplitude?
Approximately, with work, and the numbers will not tie to your billing system.
It is technically possible. You can instrument billing events (subscription started, plan changed, payment succeeded, and subscription canceled), send the plan value as a property, and build revenue metrics on top. Some teams do this.
Here is what may break over time:
- Proration and mid-cycle changes. An upgrade on the 9th is not a full month at the new rate. Getting this right is most of what a revenue analytics tool does.
- Failed payments and involuntary churn. A card declining is not a cancellation, but your product will usually not resgister the difference.
- Refunds, credits, and discounts that reduce recognized revenue without producing a user action.
- Annual plans. Recognized monthly or booked upfront? Your event stream has no opinion.
- Anything happening outside the product. Enterprise contracts invoiced manually, wire transfers, plan changes made by your support team.
The practical outcome is a revenue number that disagrees with Stripe and that someone reconciles by hand anyway before every board meeting. If you are going to put a number in front of investors, derive it from the system that actually moved the money.
The reverse is equally true. Baremetrics will not tell you which feature drives retention. If that is your question, you want product analytics, and we would rather you bought the right thing.
![Product analytics vs. Revenue analytics [FINAL FINAL]](https://baremetrics.com/hs-fs/hubfs/Product%20analytics%20vs.%20Revenue%20analytics%20%5BFINAL%20FINAL%5D.png?width=749&height=392&name=Product%20analytics%20vs.%20Revenue%20analytics%20%5BFINAL%20FINAL%5D.png)
These are questions founders usually have and what kind of tool helps them answer it
What Mixpanel does, and what it costs
![Mixpanel Product Image [2026]](https://baremetrics.com/hs-fs/hubfs/Mixpanel%20Product%20Image%20%5B2026%5D.png?width=1321&height=672&name=Mixpanel%20Product%20Image%20%5B2026%5D.png)
Mixpanel is event-based product analytics. Funnels and retention analysis are what it is known for. Core reports include Insights, Funnels, Flows, and Retention. It also ships session replay, experiments, and feature flags.
Pricing (verified September 1, 2026)
| Plan | Price | What you get |
| Free | $0 | 1M total monthly events. 5 saved reports per user, unlimited seats. Cohorts can be created but not saved. No lookup tables, custom properties, or permissions. |
| Growth | First 1M events/month free, then $0.00028 per event ($0.28 per 1,000) | Per-event rate falls as you pre-commit to higher volumes. Annual plans require committing above 1M events/month. |
| Enterprise | Custom; MTU-based Enterprise starts at $20,000/year | Access controls, data governance, Data Views, sensitive data classification, dedicated onboarding, Signal and Impact reports. |
Before you commit:
Group Analytics is a paid add-on, and it cannot be applied retroactively. This is the single most important detail for B2B SaaS. Group Analytics is what lets you analyze behavior at the account level rather than the individual user level. Which companies are engaging. Which accounts convert through a funnel. Mixpanel's own docs recommend it for all B2B products, note that implementation is not trivial, and state plainly that it cannot be applied to events already ingested. If you are B2B and you skip it at setup, adding it later does not backfill your history.
Data Pipelines is also an add-on if you want events exported to a warehouse. Both add-ons carry overage surcharges: 40% for Group Analytics, 20% for Data Pipelines, calculated on the additional data.
Free plan blocks access rather than charging you. Hit 1M events and you lose report access until you upgrade or the month resets. No surprise bill, but no data either.
Billing counts ingestion time, not event timestamp on current accounts. Backfilling historical data counts against the month you import it, which catches teams out during migrations.
You cannot set a billing limit. Mixpanel sends alerts at 85%, 100%, 110% and upward, but there is no hard cap you can configure.
What Amplitude does, and what it costs
![Amplitude Product Screenshot [2026]](https://baremetrics.com/hs-fs/hubfs/Amplitude%20Product%20Screenshot%20%5B2026%5D.png?width=2560&height=1613&name=Amplitude%20Product%20Screenshot%20%5B2026%5D.png)
Amplitude is a broader digital analytics platform. Product analytics is the core, but the platform now spans session replay, feature and web experimentation, guides and surveys, activation and audience syncing, and a substantial AI layer including agents and an MCP server.
Pricing (verified September 1, 2026)
| Plan | Price | What you get |
| Free | $0, no card, no time limit | 2M events/month. Unlimited seats, 1 year data access, 10 saved charts per org, limited experiments and guides. |
| Plus | Starts at $0, first 2M events/month free, scales with volume | Up to 700K MTU / 70M events. Custom events and formulas, 20 behavioral cohorts, alerts, heatmaps, 2-year retention. Card required. |
| Growth | Custom, event-based | Advanced behavioral exploration, SSO and project permissions, monitoring, 2-business-day support SLA. |
| Enterprise | Custom, event-based | Data access controls, RBAC and advanced user management, unlimited projects, assigned account manager. |
Ignore the third-party pricing roundups on this one. Articles published this year still describe Plus as "$49/month" with a 50,000-MTU free tier. Amplitude's own page says Plus starts at $0, and Free is 2 million events per month (verified September 2026).
Other details:
The Startup Scholarship is genuinely generous. Under 20 employees and under $10M raised gets you a free year on Growth (the tier with SSO, advanced behavioral exploration, and real support). For an early-stage company it is the most capable free product analytics we know of. Apply before you evaluate anything else. There is a second program as well: the Tech for Black Founders Scholarship gives qualifying organizations free unlimited access to Growth, including governance and dedicated onboarding. Amplitude does not publish its eligibility thresholds. Ask them.
Account-level analytics sits behind the tier line. Group behavior analysis is marked available from Plus upward, and the Accounts (Group) expanded package (account-level analytics, group-level experimentation, and B2B-focused reporting) is Growth and Enterprise only. This is the same structural issue as Mixpanel: the B2B-shaped capability is not in the entry tier.
Expanded packages are priced as a percentage of your platform plan, so add-on cost scales with base cost rather than being a flat line item.
Support is tiered steeply. Free gets community and education. Plus gets online support. A response SLA appears at Growth (2 business days) and Enterprise (1 business day).
Mixpanel vs. Amplitude: how they differ from each other
Since a lot of people arrive at this comparison choosing between the two:
Amplitude is the broader platform. Analytics, replay, experimentation, guides, activation, and AI agents are all in one place, and even the free tier touches most of it. Mixpanel is more focused on analytics itself, with experiments and flags included but less central.
Mixpanel's pricing is more legible. A published per-event rate you can multiply. Amplitude publishes a free tier and a usage-based Plus tier, then goes custom. Neither publishes enterprise pricing.
Both put B2B account-level analysis above the entry tier, which matters more for SaaS readers than almost anything else on this page.
Amplitude's free tier is more generous at 2M events against 1M, and includes far more of the platform. Mixpanel's free tier blocks access at the cap rather than charging.
We are not going to pretend to a strong opinion between them. Both are good, they are converging, and the honest advice is to run a trial with your own event volume and your own tracking plan.
Where Baremetrics fits
We are not a product analytics tool and we are not an alternative to either of these. Baremetrics cannot build a funnel, replay a session, or run an experiment. If those are your questions, buy Mixpanel or Amplitude.
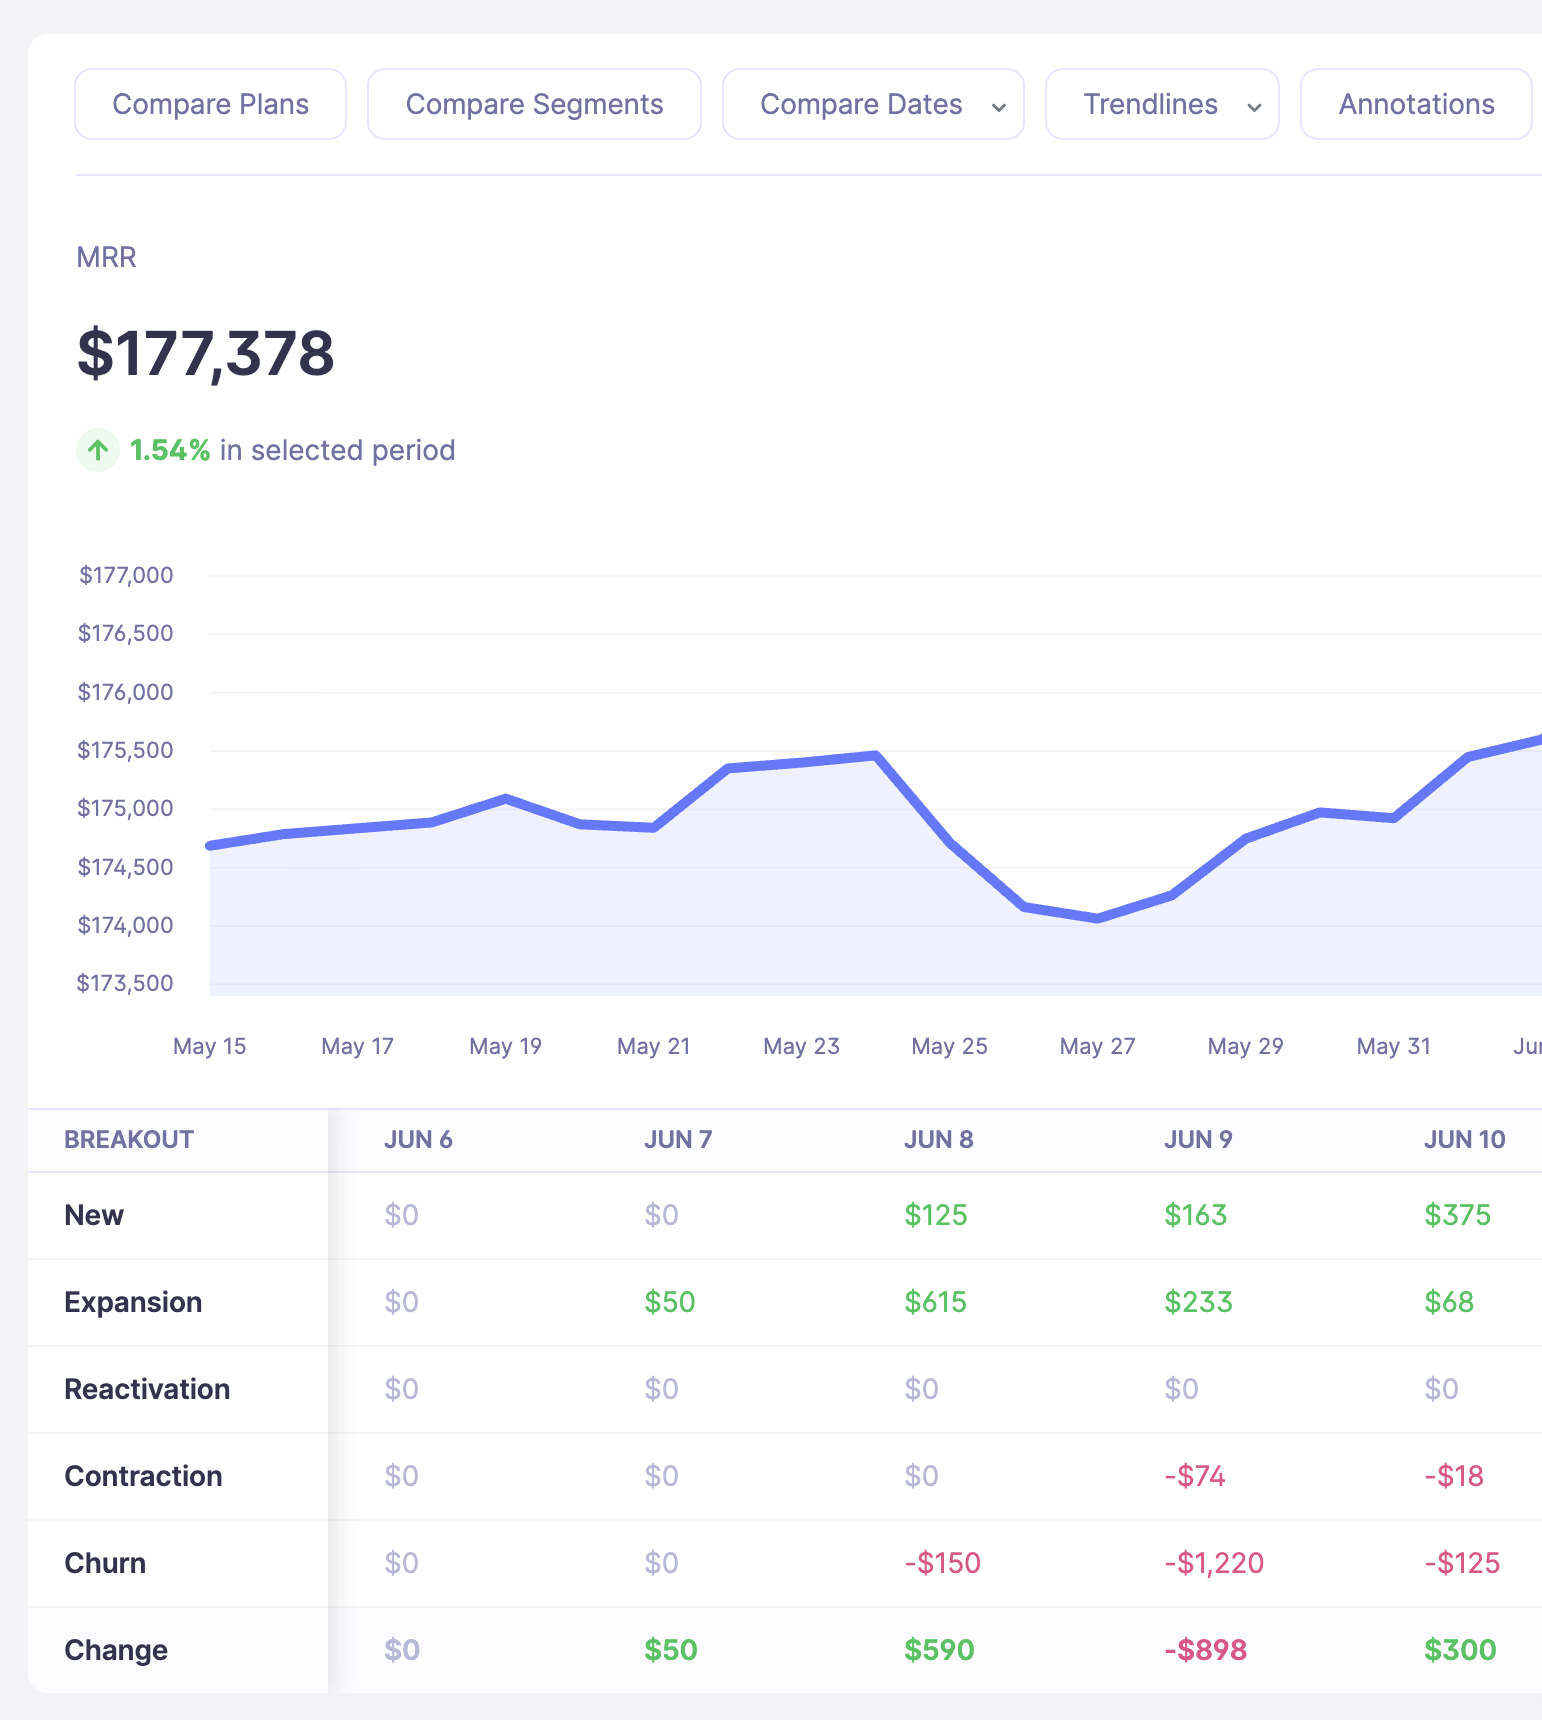
MRR waterfall in Baremetrics
What Baremetrics does is read your billing system and answer revenue questions without instrumentation:
- MRR with a full movement breakdown — new, expansion, reactivation, contraction, and churn, by day. Not a total, a story of how the total changed.
- Churn, retention, and cohort tables — revenue and customer retention by cohort, so you can see whether the drop-off is month one or month nine.
- Segmentation and custom dashboards — slice by plan, country, billing cadence, or attributes pushed from HubSpot, Intercom, or your own API. Compare segments on the same graph.
- Investor-ready reporting — a shareable dashboard link with customer PII stripped, so investors can dig in without seeing your customer list.
- Forecast+ — connects QuickBooks or Xero and pulls your actual P&L in, so runway, burn rate, CAC, and budget variance sit next to your subscription metrics. Included with any paid plan.
- Recover ($129/month add-on) — automated failed-payment recovery: up to seven fully customizable emails, a branded card-update page, in-app banners escalating to a paywall, and SMS. Published guarantee: recover more than your Baremetrics cost or your next month is free.
- Cancellation Insights ($129/month add-on) — a widget on your cancel button that captures the reason before the customer leaves, with reason-specific follow-up.
Setup is an OAuth connection. Your full billing history comes in with it, including years of past data. Pricing is banded by ARR: Launch $49/month up to $360K ARR, Growth $189/month to $3.6M, Scale $749/month above that, on annual billing.
One structural point: product analytics prices on event volume, which tracks your revenue only loosely. A consumer app with 50,000 users and $20K MRR can generate enormous event volume and a large product analytics bill. A B2B SaaS with 200 accounts and $300K MRR generates very few events. Revenue analytics prices on revenue. If your event volume and your revenue are wildly out of proportion in either direction, that changes the total cost picture more than any feature comparison will.
💬 CTA: Already running Mixpanel or Amplitude and missing the revenue side? Book a call — we will connect your billing data and show you what the revenue picture looks like next to your product data.
Comparison table
| Baremetrics | Mixpanel | Amplitude | |
| Category | Subscription revenue analytics | Product analytics | Digital analytics platform |
| Reads | Billing system | Event stream | Event stream |
| Priced on | ARR band | Events | Events / MTU |
| Setup | OAuth to billing, minutes | Event instrumentation | Event instrumentation |
| MRR, ARR, movement breakdown | ✅ Automatic | Only if you instrument it | Only if you instrument it |
| Revenue churn, NRR, cohort retention by revenue | ✅ | ❌ | ❌ |
| Failed payment recovery | ✅ Recover ($129/mo add-on) | ❌ | ❌ |
| Cancellation reason capture | ✅ Cancellation Insights ($129/mo add-on) | ❌ | ✅ Guides and Surveys |
| Financial forecasting (runway, burn, CAC) | ✅ Forecast+ | ❌ | ❌ |
| Behavioral funnels and flows | ❌ | ✅ | ✅ |
| Behavioral retention curves | ❌ | ✅ | ✅ |
| Session replay | ❌ | ✅ | ✅ |
| Experimentation / feature flags | ❌ | ✅ | ✅ |
| Account-level (B2B) analysis | ✅ Native — customers are accounts | Paid add-on, not retroactive | Growth / Enterprise package |
| Free plan | ❌ | ✅ 1M events | ✅ 2M events |
| Entry paid price | $49/mo (annual) | $0.28 per 1,000 events above 1M | Starts at $0, scales with volume |
| Warehouse export | ❌ | Add-on | Not a published plan feature; syncs limited, add-on on Growth+ |
Which do you actually need?
You need revenue analytics if the question is MRR, churn, NRR or GRR, LTV, cohort retention by revenue, runway, or failed payments — or if an investor, board member, or banker is asking. Instrumenting events to answer these is the long way round to a number that will not reconcile.
You need product analytics if the question is which feature drives retention, where users drop out of onboarding, what the activation path looks like, or whether a change improved anything. No billing system knows any of this.
You probably need both, eventually. The sequence we usually see: revenue analytics first, because the questions arrive earlier and from more senior people, then product analytics once you have enough usage for behavioral patterns to mean anything.
If you are early and budget-constrained, both product analytics tools have real free tiers, and Amplitude gives qualifying startups a free year on Growth. Revenue analytics has no free option from us. Launch is $49/month. It also does not require an engineer to instrument anything.