Table of Contents

Is there a version of your product that could be selling better?
Unless you’ve performed extensive market testing, the answer to that question is probably ‘yes’. There’s a strong chance that minor changes to your SaaS service could significantly boost your sales.
The better your product/market fit is, the better your product will perform on the market: happy customers will recommend your company to others, sales will increase, churn rates will drop, and your business will grow steadily.
So how do you improve your product/market fit?
This is where a powerful market research tool known as conjoint analysis comes in.
Read on to find out what conjoint analysis is, how to conduct this type of survey, and how to use its findings to create a best-selling SaaS product.
What is product/market fit
We’ve broken down the concept of product/market fit in detail here.
In short, good product/market fit requires two factors:
- there is a substantial market for the product (i.e. enough demand in this sector for your business to grow over time)
- the product’s features and price-point align with the demands of the market
Here we’ll be focusing on the second aspect, namely optimizing your product to best suit the needs of your users.
How to optimize product/market fit
Improving product/market fit is an iterative process. Every change you make should bring your product in closer alignment with the needs of the users your business is hoping to attract, in other words, your Ideal Customer Profiles.
The best way to determine what those needs are, and assess how well your product currently satisfies them, is to collect data through surveys.
Surveys as a market research tool
Many SaaS businesses opt for user satisfaction surveys to measure the success of their products. The Net Promoter Score, for example, is an excellent type of survey for tracking and improving customer loyalty.
The problem is that it’s not enough to rely on an NPS or similar survey alone in order to make data-backed R&D decisions.
Here are some of the reasons why this type of survey isn’t a reliable basis for making product adjustments:
- Data is too linear (usually on a scale of 1-10, or unsatisfied-highly satisfied) and only looks at a product’s current version
- Answer values are qualitative, subjective, and inconsistent across different users
- Results don’t offer practical feedback on how to improve specific product features
Essentially, user satisfaction surveys don’t provide enough hard data to inform service optimization. If you’re looking for actionable insights, the best method available is a form of statistics-based research known as conjoint analysis.
What is conjoint analysis?
Conjoint analysis is a market research tool used to determine which version of a product will sell the best. There are different types of conjoint analysis; this article uses generic, discrete choice-based conjoint, which is the most common type for testing different product features, marginal willingness to pay for those features, optimal pricing etc.
This type of survey maps out consumer preferences with a series of questions of ‘would you rather’.
Would you rather buy a blue car, or a purple one?Would you rather drink this beverage out of a cardboard container, or a glass bottle?Would you rather pay $9.95, or $10 for this service?
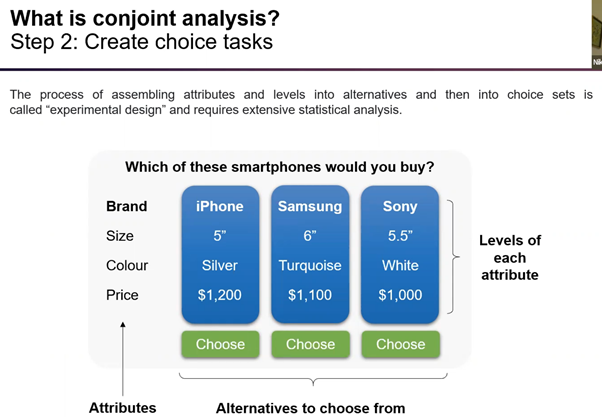
These yes/no queries are the basis for the survey; the actual questions (known as choice sets) ask respondents to choose between complete products combining different feature variations for the sake of realism. This is known as experimental design.
You don’t need a background in statistics to run a conjoint analysis survey, by the way – dedicated software can take care of that for you. Here we’ll be using the software service conjoint.ly to illustrate how to create a conjoint analysis survey, and how to interpret its results.
How to perform a conjoint analysis survey
In order to conduct a conjoint analysis survey, first you need to decide what kind of alternatives within your product or service you want to test for.
This is done by breaking down your product into several components. These are referred to as attributes and levels.
Let’s look at this example survey for a mobile phone.
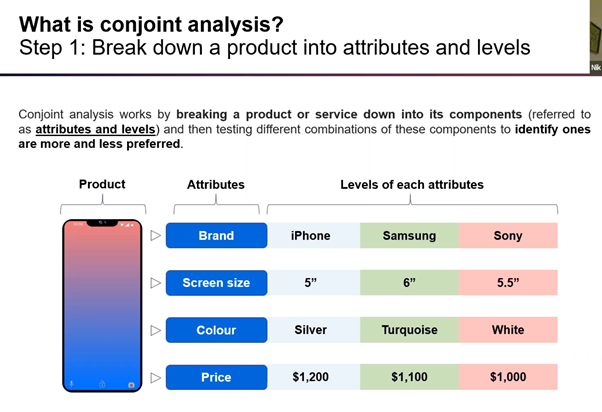
This product survey asks consumers to select their preferences for four separate attributes: brand, screen size, color, and price. Each of these attributes has levels (a.k.a. possible values) to choose between. Note that this graphic is an overview, not an actual survey question.
The more options for attributes and levels you give, the more respondents and survey questions you’ll need in order to produce statistically significant results. On the flipside, you need to test for more than a couple of attributes at a time to produce surveys with enough breadth.
Selecting attributes
If you’re unsure about what kinds of attributes to pick, consider what features impact your consumers’ purchasing decisions the most. For physical products such as a phone, size, color, and price are popular question topics. A conjoint analysis survey for a SaaS product, on the other hand, might ask about opt-in features, pricing, ad copy, etc.
Price is an important attribute to include as one of your test attributes: it provides a baseline to test other features against, and generates invaluable data on consumers’ willingness to pay for the other attributes (more on this later).
Optimizing your questions
Make sure that the levels of each choice set have the following characteristics:
-
Precise, exact values
-
Mutually exclusive options
-
Realistic alternatives for the market
Survey structure
A typical survey has around 12 questions. That being said, dedicated conjoint software proposes an appropriate number of questions and respondents for the complexity of your desired test.
Each question asks consumers to choose between complete product alternatives with a unique combination of values. This process determines which combination of features will result in the most popular product.
The values within each choice set are randomized, i.e. no two respondents’ surveys will be identical.
Creating a survey
So, let’s take a look at how to set up a survey from scratch using the software conjoint.ly.
(NB: if calculating coefficients is your jam, you can run conjoint analysis with email and a spreadsheet instead of using dedicated programs. Otherwise, software such as conjoint.ly can take care of the process for you, including creating your surveys, mapping its results on graphs, and interpolating real-life uses for this information.)

To get started, simply fill in some basic information about your product, and specify which attributes and levels you want to test for.
On the welcome page of your survey, it’s generally a good idea to ask questions about your respondents, too, so you can begin to map consumer profiles. Age, gender, country, number of people working in their organization etc are popular market research questions for this section.
You can narrow the pool of respondents to match your ICPs by setting criteria such as ‘car users; ages 30-49; living in the USA’, for example. By running multiple parallel surveys with different types of user groups, you can effectively run a complete customer segmentation analysis, and compare your findings across different categories within your ICPs.
For SaaS products, it’s very important that your respondents truly understand what your product does before completing a survey. You can include a quick demo or tutorial in the introduction to encourage educated responses.
Interpreting responses
Once enough respondents have filled out your survey, it’s time to interpret their data.
Conjoint analysis will not only map out which product options are the most popular in absolute terms, but by using coefficients, will weigh how much individual attributes impact consumer behavior.
This helps distinguish between marginal preferences for one option over another, vs. total deal-breakers.

Source: Conjoint Analysis | Complete guide to conjoint analysis | QuestionPro
Going back to the mobile phone example, respondents to this survey care about the brand twice as much as they do about screen size.
Real life application
Why does it matter by how much respondents prefer one option over another?
In an ideal world, you want to create the perfect product for your consumer base.
As a business, however, you also need to take into account what it would cost to make that perfect product a reality. Let’s say respondents prefer 24/7 customer support over business-hours only, but rank the level of importance for those extra hours at 10%. Those extra hours for your team are likely to cost you more than you’d eventually gain in revenue by offering round-the-clock service.
Marginal willingness to pay
If you’re testing for price (as we recommend you do), conjoint analysis coefficients also calculate respondents’ marginal willingness to pay. In simple terms, marginal willingness to pay determines how much a consumer would be willing to pay for one version of a product feature compared to another.
Let’s take a look at a new body lotion. This part of the survey investigates what bottle shape respondents prefer, and how much they are willing to pay for those preferences.
")
Source: How It Works – Conjoint.ly (conjointly.com)
For this comparison, we first need to set a baseline to compare alternatives against. In this case, the baseline is calibrated to the S-shape bottle.
With S-shape set to 0, we can compare how much more or less respondents are willing to pay for the other shapes by comparison. This is shown by the red bars either to the left (negative values) or right (positive values) of the baseline. For instance, a rectangle bottle is worth -$1.67 in comparison to S-shape, whereas U-shape is worth +$1.25 in comparison.
This aspect of conjoint analysis provides hard data on what your optimal product price range is, and helps establish how price sensitive your ICPs are.
")
Source: Modern marketer’s guide to conjoint analysis (bigdata-madesimple.com)
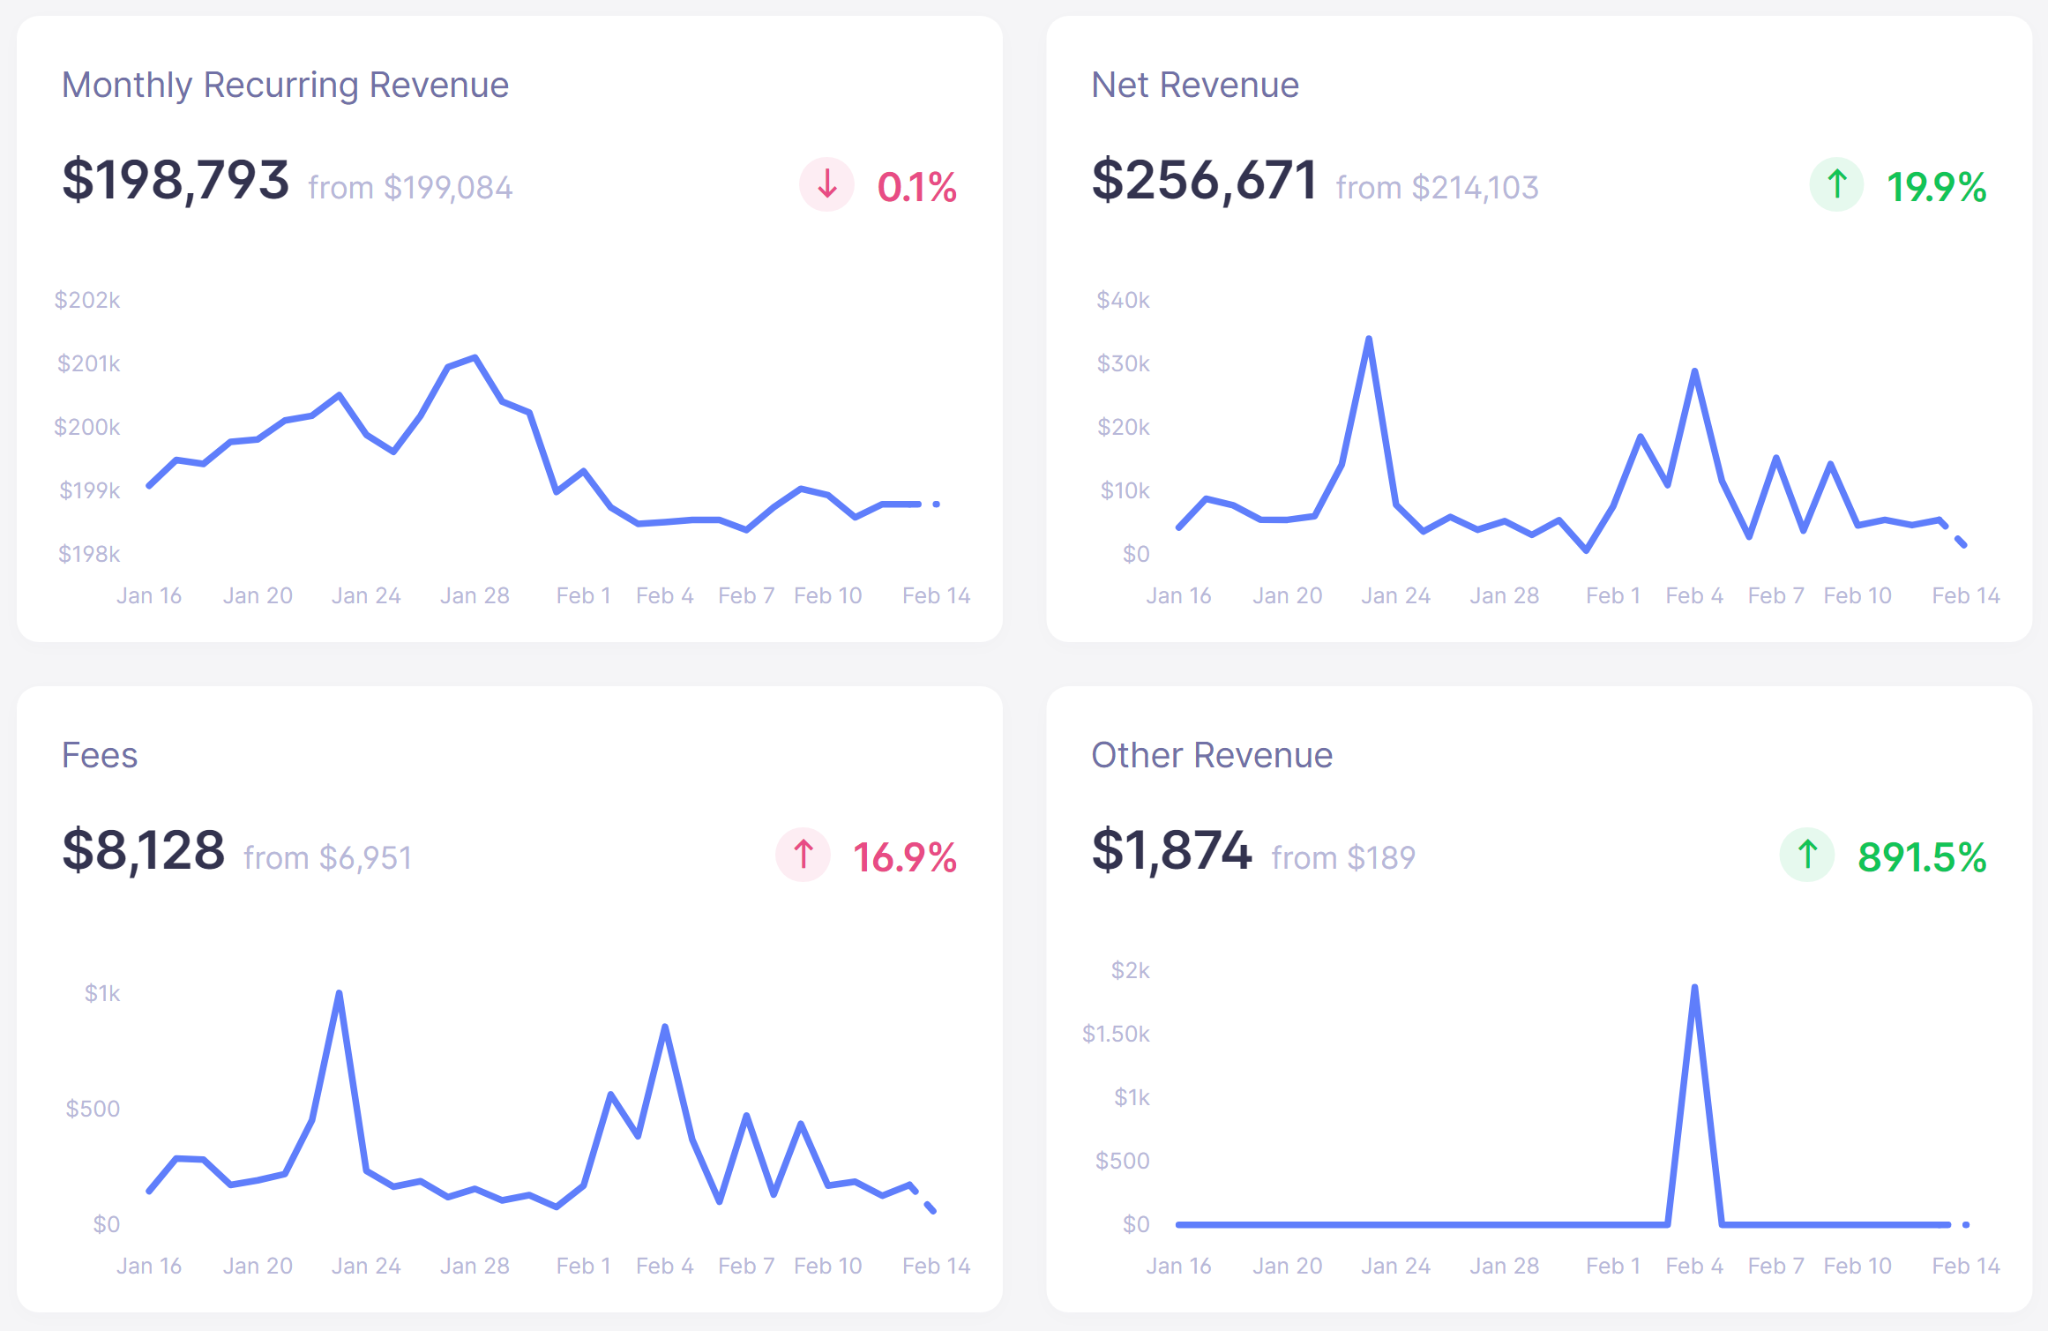
Conjoint analysis and Baremetrics
As a market research tool, conjoint analysis provides invaluable insight into the decision-making mechanisms of buyers.
In order to implement these findings most effectively, Baremetrics analyzes your subscription data and presents it on an intuitive, up-to-date dashboard.