Table of Contents

The income statement is one of the three main statements that show the financial health of a company (along with the balance sheet and the statement of cash flows).
Check out an example income statement here:
|
ABC Corporation |
|||
|
Income Statement (in thousands) |
Year ending 12/31/2021 |
||
|
Revenue |
|||
|
Monthly Subscriptions |
50,000 |
||
|
Recognized Portion of Annual Subscriptions |
20,000 |
||
|
|
|||
|
Less returns, discounts, and refunds |
12,000 |
||
|
Net Sales Revenue |
58,000 |
||
|
Costs of Goods Sold |
|||
|
Hosting Fees, Payment Gateway Fees, etc. |
5,000 |
||
|
Labor Costs |
3,000 |
||
|
Total Costs of Goods Sold |
8,000 |
||
|
Gross Profit |
50,000 |
||
|
Expenses |
|||
|
Rent |
12,000 |
||
|
Utilities |
6,000 |
||
|
Administration Expenses |
10,000 |
||
|
Salaries |
10,000 |
||
|
Depreciation |
4,000 |
||
|
Amortization |
4,000 |
||
|
Interest on bank loan |
3,000 |
||
|
Total Expenses |
49,000 |
||
|
Gains |
|||
|
Sale of underperforming platform |
10,000 |
||
|
Losses |
|||
|
Disposal fee for old equipment |
1,000 |
||
|
EBITDA |
21,000 |
||
|
EBIT |
13,000 |
||
|
Taxes Owed |
2,000 |
||
|
Net Income |
8,000 |
||
This article will break down this example income statement so you can fully understand it.
Income statement vs. cash flow vs. balance sheet
The income statement has many names—profit and loss account, profit and loss statement, statement of profit and loss, statement of operations, statement of financial performance, statement of earnings, earnings statement, revenue statement, and operating statement—but we’ll stick with calling it the income statement here.
The income statement lists all the revenue and expenses of the company, any other gains and losses, and then it has a tally at the bottom which shows your net profit (or loss). Similar to the statement of cash flows, which shows the way cash is flowing into and out of your company, the income statement is drafted for a period of time.
Conversely, the balance sheet, which shows your assets, liabilities, and owner’s equity, is drafted for an exact moment in time.
In the SaaS world, your revenue is probably recurring, regardless of the revenue model you have chosen. The biggest challenges when drafting an income statement for a subscription SaaS provider will be understanding when you can recognize your revenue and expenses according to the accrual accounting method. This means knowing when your revenue is earned and your expenses are incurred.
That means you need to be tracking your MRR, ARR, LTV, churn, dunning, and more. Finding the time and skills to do this in-house is a distraction from your core mission.
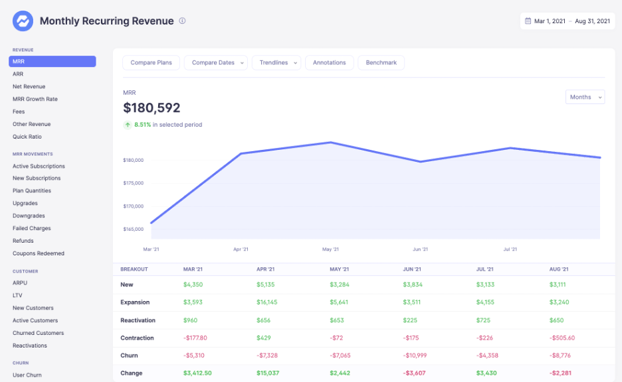
That’s where Baremetrics comes in. Baremetrics monitors subscription revenue for businesses that bring in revenue through subscription-based services. Baremetrics can integrate directly with your payment gateway, such as Stripe, and pull information about your customers and their behavior into a crystal-clear dashboard. Check out what the MRR graph looks like right here:
Sign up for the Baremetrics free trial and start managing your subscription business right.
What are the components of an income statement?
The income statement is very information-dense. It shows all your revenue and expenses, which are the money you bring in and the costs of your business, respectively. It also shows other gains and losses, for example interest on an account or a settlement from a lawsuit. It also shows your profit (or loss).
Depending on how detailed the income statement is, it might also include other subtotals, such as your EBIT (earnings before interest and taxes) and EBITDA (earnings before interest, taxes, depreciation, and amortization).
Below we’ll list all of the information that might be found on an income statement. Depending on the complexity of your company and local regulatory requirements, the information contained and the format of the income statement can vary widely.
1. Revenue (or Sales)
The revenue section is the very top of the income statement. It details all the money you have made based on your core business processes. It can be separated into your different revenue streams or just listed as a single item. It might also include the negative value of returns, defects, etc., which is followed by your net revenue value.
2. Expenses
There are several different places where expenses are shown. Usually, the costs of goods sold are shown after the net revenue to calculate the gross profit, while the other expenses follow in a dedicated section.
Expenses can be separated into the two types of cash expenses and non-cash expenses. They can also be separated into the two types of operating expenses and non-operating expenses.
i. Cash expenses
Cost of Goods Sold (COGS): COGS commonly follows the revenue on the income statement so that the gross profit can be calculated and presented before other expenses are shown. This is the total cost of sales or services, also referred to as the cost incurred to manufacture goods or services. COGS only includes the direct costs of producing your service and not the indirect costs, such as overhead.
Operating Expenses: These are the expenses generated by a company’s core business activities. Operating expenses include payroll, pension contributions, and sales commission.
Non-Operating Expenses: The expenses that are not generated by core business activities are known as non-operating expenses. Examples of non-operating expenses include obsolete inventory charges.
ii. Non-cash expenses
Non-cash expenses are a lot more complicated than cash expenses. These do not involve any cash flow and are simply a way of turning long-term tangible and intangible assets (i.e., depreciation and amortization) into expenses to improve your tax situation. This is why some companies prefer to present their EBIT and EBITDA to investors as a better presentation of their current financial health, even though they are not GAAP approved.
Depreciation: Depreciation is a method for spreading the cost of a long-term tangible asset over its useful life. Depreciable assets can include buildings, equipment, office furniture, vehicles, land, and machinery.
Amortization: Amortization is a system for spreading the cost of an intangible asset over the course of its useful life. Amortizable assets can include patents and trademarks, franchise agreements, proprietary processes, and the cost of issuing bonds to raise capital.
3. Gains and Losses
Gains and losses appear similar to revenue and expenses, respectively, but they are typically one-time, rare, and unexpected events. They often represent the money gained or lost from a market pivot or operations restructuring.
Gains sometimes follow revenue and losses expenses on the income statement, but they can also be incorporated into those sections or follow both revenues and expenses together at the bottom of the income statement only preceding the final tally of profit or loss. In the example income statement below, we use the last option for clarity.
Don’t confuse the term loss meaning a negative net profit with losses meaning these one-time negative monetary events!
Gains: Gains are the results of positive financial events not related to the company’s core activities. Gains indicate the amount of money gained by the company from one-off events. They can include the sale of an operating segment. For example, Baremetrics sold Intros for $100,000. Gains can also come from selling off old vehicles, unused lands, etc.
Losses: Similarly, losses are the results of negative financial events not related to the company’s core activities. Losses indicate the amount of money the company lost from such one-off events. They can include the settlement of a lawsuit or a loss due to a stock trade.
4. Totals
Throughout the income statement, you will find some totals. Aside from total revenue, total expenses, and net revenue, you usually find the gross profit after the revenue and COGS, the net income right at the bottom, and, depending on the level of detail, EBIT and EBITDA as well.
Gross Profit: Gross profit is the net revenue minus COGS. It is sometimes turned into a percentage, which is called the gross profit margin
EBIT (or Operating Earnings): This is a non-GAAP measure of a company’s financial performance. It tells you how much the company has made before subtracting interest and taxes.
EBITDA: This is another non-GAAP measure of profitability. In addition to not including interest and taxes, EBITDA subtracts non-cash expenses, i.e., depreciation and amortization, as well. This can give you an idea of the true profitability of the period since depreciation and amortization are accounting expenses only.
Net Income: Net profit (or loss) is the amount of money your company finally earned (or lost). It comes at the very bottom of the income statement and is net of everything including COGS, cash and non-cash expenses, interest on your loans, and taxes.
Example of an income statement for SaaS?
Below is an example income statement. At the top, you can see the company’s name, the date, and the period. This income statement is for the creatively named “ABC Corporation” and is for the year ending 2021. You can also see that this is represented in thousands (so 50,000 actually means $50,000,000 and so on).
Under the revenue section, monthly and annual subscriptions are separated. This company must feel that it is important to keep track of these separately because they have different bearings on the financial health of the business.
The company has $70,000,000 in gross sales, which results in $58,000,000 in net sales after all refunds and discounts. With low COGS of $8,000,000, the company has a robust gross profit of $50,000,000.
However, the bulk of its expenses are not represented by COGS, totalling an additional $49,000,000. In fact, without the one-time sale under gains, there’d be almost no profit at the end of the year.
You can see that net income, EBIT, and EBITDA are all presented. Net income includes everything, while EBITDA ignores the bottom three expenses and taxes and EBIT doesn’t include the last expense and taxes.
|
ABC Corporation |
|||
|
Income Statement (in thousands) |
Year ending 12/31/2021 |
||
|
Revenue |
|||
|
Monthly Subscriptions |
50,000 |
||
|
Recognized Portion of Annual Subscriptions |
20,000 |
||
|
|
|||
|
Less returns, discounts, and refunds |
12,000 |
||
|
Net Sales Revenue |
58,000 |
||
|
Costs of Goods Sold |
|||
|
Hosting Fees, Payment Gateway Fees, etc. |
5,000 |
||
|
Labor Costs |
3,000 |
||
|
Total Costs of Goods Sold |
8,000 |
||
|
Gross Profit |
50,000 |
||
|
Expenses |
|||
|
Rent |
12,000 |
||
|
Utilities |
6,000 |
||
|
Administration Expenses |
10,000 |
||
|
Salaries |
10,000 |
||
|
Depreciation |
4,000 |
||
|
Amortization |
4,000 |
||
|
Interest on bank loan |
3,000 |
||
|
Total Expenses |
49,000 |
||
|
Gains |
|||
|
Sale of underperforming platform |
10,000 |
||
|
Losses |
|||
|
Disposal fee for old equipment |
1,000 |
||
|
EBITDA |
21,000 |
||
|
EBIT |
13,000 |
||
|
Taxes Owed |
2,000 |
||
|
Net Income |
8,000 |
||
Use Baremetrics to make income statements for SaaS
The most important differences when drafting an income statement for your SaaS enterprise come down to revenue recognition. ASC 606 has defined clearly when revenue can be recognized with specific guidelines in place for subscription revenue.
Understanding when revenue has or has not been earned, as well as when the cash has or has not been received, requires special tools, and Baremetrics provides them all.