Table of Contents
Value-based pricing in SaaS ties pricing directly to the outcomes customers achieve, like time saved or revenue generated. This approach can improve win rates, boost Net Revenue Retention (NRR), and align pricing with customer value. To implement it effectively, you need to track the right metrics, segment customers, and align product features with measurable value.
Key Takeaways:
- Customer Segmentation: Group users by usage patterns, company size, or use cases to tailor pricing.
- Willingness to Pay: Use customer interviews, pilots, and A/B testing to gauge price sensitivity.
- Feature Value Mapping: Identify which features drive retention and revenue growth.
- Pricing Metrics: Choose metrics that reflect customer outcomes, are simple, measurable, and scalable.
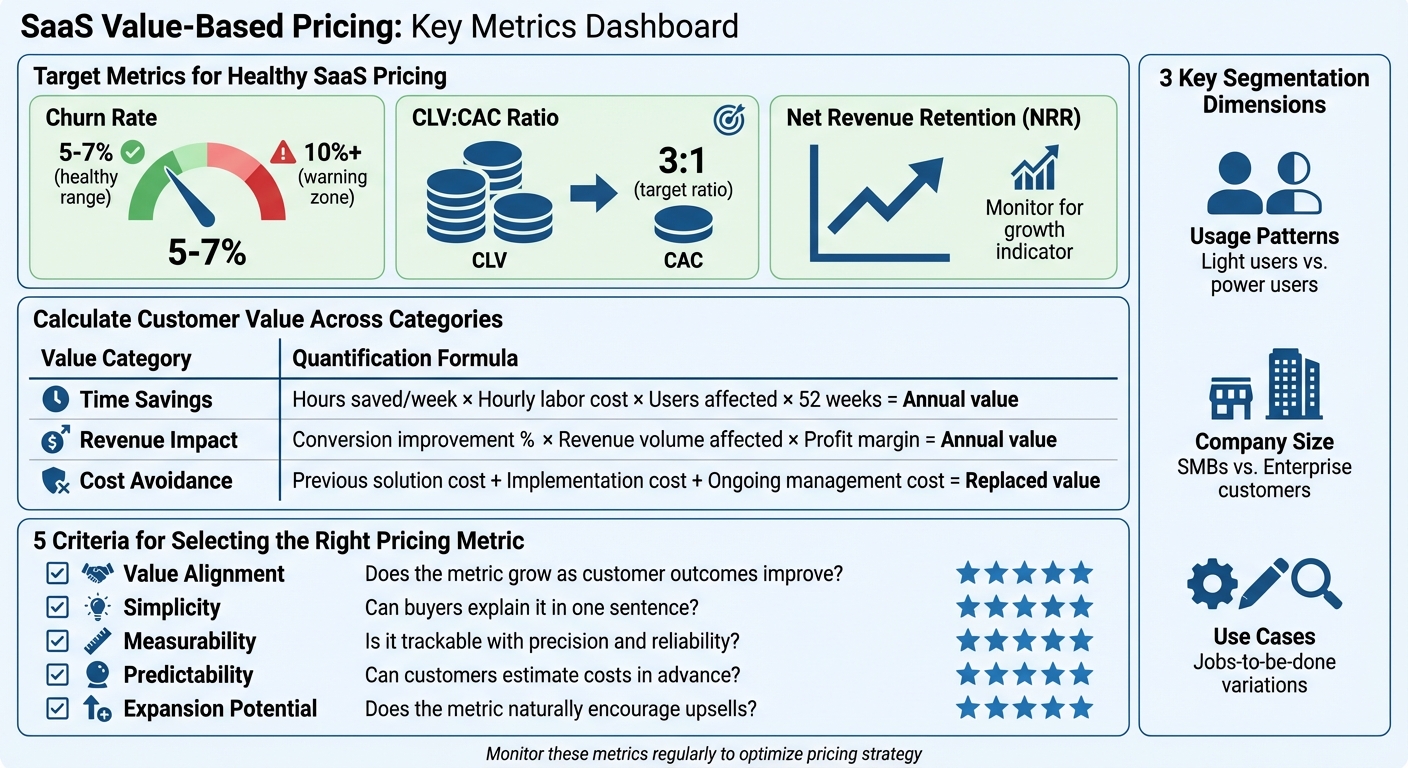
- Performance Monitoring: Track churn (aim for 5–7%), CLV:CAC ratio (target 3:1), and NRR to refine pricing.
SaaS Value-Based Pricing Key Metrics and Benchmarks
Customer Segmentation and Willingness to Pay
Identifying Customer Segments
When it comes to value-based pricing, breaking your customer base into meaningful segments is crucial. This segmentation typically revolves around three key dimensions:
- Usage patterns: Not all customers use your product the same way. Light users and power users often see value differently, so their pricing needs will vary.
- Company size: Small and medium-sized businesses (SMBs) and enterprise customers have different expectations. For instance, enterprises might lean toward per-seat pricing, while SMBs often prefer straightforward pricing models.
- Use cases and jobs-to-be-done: Customers who use your product to solve different problems tend to value different features. Understanding these variations helps tailor pricing to their specific needs.
Take a collaboration tool as an example. By categorizing users into "creators" and "viewers", you uncover distinct value drivers for each group. The challenge is ensuring your pricing metrics strike a balance - complex enough to satisfy enterprise procurement teams yet simple enough for SMBs. And, of course, fairness across all use cases is non-negotiable.
Tools like Baremetrics can be a game-changer here. They provide detailed analytics, including segmentation and cohort analysis, so you can pinpoint which customer groups are most profitable and sensitive to pricing. Key metrics like ARPU (Average Revenue Per User), NRR (Net Revenue Retention), and expansion revenue by segment offer insights into how different groups respond to your pricing strategy.
Once you've identified these segments, it's time to test how they react to specific pricing models.
Measuring Willingness to Pay
Understanding how much your customers are willing to pay requires a mix of strategies:
- Customer interviews: Present a couple of pricing options - such as per-seat pricing versus a usage-based model like "per 1,000 documents processed" - and gauge their perceived value.
- Offer tests and pilots: Run small-scale pilots with varying pricing metrics tailored to similar customer profiles. Analyze conversion rates, expansion opportunities, and customer feedback to see what resonates.
- Limited rollouts or A/B testing: Introduce a new pricing model to a subset of new customers while keeping the old pricing model for others. Compare the performance of both groups to evaluate the impact.
Beyond these methods, financial analysis plays a vital role. Metrics like Customer Lifetime Value (CLTV) and Customer Acquisition Cost (CAC) help you determine what your pricing should look like. For example, if your CAC is $500 and your estimated CLTV is $3,000, you have a clearer idea of what customers can afford while maintaining profitability. During interviews, dig into their perceptions of value, budget limitations, and how predictable costs need to be for them to feel comfortable.
Mapping Product Features to Customer Value
Identifying Value Drivers
Once you've segmented your customers, the next step is figuring out which product features truly matter to them. This means aligning your product’s capabilities with the specific value each group is looking for. The best way to verify this is through usage data.
Start by analyzing how your high-value customers use your product. Look for features that correlate with strong Customer Lifetime Value (LTV) and high retention rates. For instance, if a particular feature results in a 3:1 LTV to CAC (Customer Acquisition Cost) ratio, it’s a clear indicator that this feature is delivering measurable value.
Key features often create value in several ways: cutting costs (like reducing labor or tool expenses), boosting revenue (by improving acquisition or retention), increasing efficiency (saving time or enhancing productivity), or minimizing risk (think compliance or security improvements). When interviewing top customers, ask how they justify your product’s cost within their organization and which KPIs they use to measure success. Their answers will help you identify which features have the most tangible impact.
From there, tie these features to clear, numerical outcomes to refine your pricing strategy.
Quantifying Customer Outcomes
To highlight value, assign measurable outcomes to your product’s key features. Avoid vague claims like "our tool increases revenue." Instead, focus on specific, measurable results. For example, saying "we reduce proposal turnaround time from 3 days to 4 hours" provides a concrete and verifiable improvement. Track baseline metrics before customers start using your product so you can clearly demonstrate the difference it makes.
Here’s a simple way to calculate value across different categories:
| Value Category | Quantification Formula |
|---|---|
| Time Savings | Hours saved per week × Hourly labor cost × Users affected × 52 weeks = Annual value |
| Revenue Impact | Conversion improvement % × Revenue volume affected × Profit margin = Annual value |
| Cost Avoidance | Previous solution cost + Implementation cost + Ongoing management cost = Replaced value |
Tools like Baremetrics can make this process easier. By tracking metrics such as LTV by plan and segmenting performance by customer groups, you can identify which features drive the most value. For example, if customers on a specific pricing tier have notably low churn rates (healthy churn for SaaS companies is typically around 5–7% per month), you can attribute that retention to the features included in that tier.
Additionally, this data can help you create interactive ROI calculators. These tools let prospects input their own data - like employee count or hourly rates - to generate customized value estimates. It’s a powerful way to show potential customers exactly how your product can benefit them.
Selecting the Right Pricing Metrics
Evaluating Potential Pricing Metrics
When crafting a value-based pricing strategy, choosing the right pricing metric is a critical step. The metric you select should directly reflect the value your customers derive from your product. Common SaaS pricing models include per-user (e.g., charging for each active editor in a collaboration tool), usage-based (such as the number of invoices processed monthly in billing software), per-feature (like workflows executed in automation platforms), and tiered pricing.
Good pricing metrics align closely with customer outcomes, remain straightforward, and scale as the customer grows. On the other hand, poorly chosen metrics - like charging based on the "number of projects" when customers could consolidate their work into fewer projects - can break the connection between value received and price paid.
To identify the best metric, evaluate each option on a 1–5 scale using these criteria:
- Value alignment: Does the metric grow as customer outcomes improve?
- Simplicity: Can buyers easily explain it in one sentence?
- Measurability: Is it trackable with precision and reliability?
- Predictability: Can customers estimate their costs in advance?
- Expansion potential: Does the metric naturally encourage upsells? [2,8]
Once you've shortlisted 2–4 metrics, test them with different customer segments. For example, SMBs often prioritize simplicity, while larger enterprises lean toward predictability. Use customer interviews to gauge fairness and preference - questions like, "Would you rather pay per seat or per 1,000 documents processed?" can provide valuable insights. Testing across segments ensures the metric aligns with both fairness and revenue goals. Finally, verify that your technical infrastructure can support accurate measurement and billing for the chosen metric.
Ensuring Implementation Feasibility
Even the most well-aligned metric is ineffective if your systems can’t measure or bill for it accurately. Start by confirming that your billing system can handle the metric without requiring manual interventions. Ensure existing integrations reliably track the metric and that the data quality is high enough to minimize disputes.
Platforms like Baremetrics streamline this process by consolidating data from various payment processors and revenue sources, offering a real-time view of key metrics like active users or usage volume. This unified approach is essential - if your metric requires frequent exceptions or custom handling, it’s likely not the right choice.
Additionally, the metric should provide customers with cost predictability. If buyers struggle to forecast their monthly expenses, adoption rates could decline. After implementation, monitor key performance indicators (KPIs) like win rates, Average Revenue Per User (ARPU), Net Revenue Retention (NRR), and billing-related support tickets. These metrics will help you validate whether your pricing choice is driving both customer satisfaction and business growth [2,6].
sbb-itb-18a9912
Monitoring and Optimizing Pricing Performance
Key Performance Indicators for Pricing
Once you've established customer segmentation and determined feature value, the next step is to keep a close eye on how your pricing strategy performs. Effective tracking and optimization ensure your pricing evolves and improves over time. After rolling out a value-based pricing model, start by monitoring win/loss rates. If competitors consistently win deals, it could signal that your pricing isn't aligned with customer expectations. Additionally, keep an eye on average deal size and sales cycle length to confirm that buyers both understand and accept your pricing model.
Some key long-term metrics include Customer Lifetime Value (LTV), churn rate, and the CLV-to-Customer Acquisition Cost (CAC) ratio. Ideally, churn should stay between 5–7%, and anything above 10% may indicate deeper issues. A healthy CLV:CAC ratio is typically around 3:1. If a particular cohort shows consistently high churn, it might signal emerging pricing challenges that broader metrics don't immediately reveal.
Another critical measure is Net Revenue Retention (NRR), which shows whether customers are increasing their spending over time. In successful SaaS models, revenue from upgrades and increased usage often surpasses revenue from new customers in a given month. Monitoring Average Revenue Per User (ARPU) across pricing tiers and customer segments is equally important. If ARPU trends downward in specific segments, it might indicate that your pricing structure doesn't scale well with customer growth. On top of these metrics, keep an eye on billing complaints, as they can provide direct feedback on customer satisfaction with pricing.
"In most cases, contraction is a value issue. People don't feel like they're getting enough value from their current subscription to justify the price".
By tracking these indicators, you lay the groundwork for deeper analysis, such as cohort studies, to uncover trends and refine your pricing strategy further.
Using Cohort Analysis for Insights
Cohort analysis groups customers based on shared characteristics - such as their sign-up date or pricing tier - and tracks their behavior over time. This method helps you see whether your pricing model works consistently across different customer types. For example, you might compare how small-to-medium businesses respond to per-seat pricing versus usage-based models compared to enterprise clients. Metrics like retention and expansion revenue for each group can reveal which pricing structures resonate best.
Analyzing revenue contributions and churn rates by cohort can also highlight problem areas. For instance, if customers acquired in Q1 2025 show higher churn than those from Q4 2024, it could point to a pricing change during that period. Tools like Baremetrics simplify this process by offering built-in cohort analysis features. These platforms connect directly to your payment processor, providing real-time insights into how different pricing strategies impact retention and expansion.
Segmenting Lifetime Value (LTV) by pricing tier can also shed light on which plans deliver the greatest value over time. Lower-priced plans often experience higher churn and lower LTV, while premium tiers tend to perform better in both areas. If a specific cohort generates unusually high expansion revenue, dig into what drives their growth. Use those findings to adjust your pricing tiers and replicate successful strategies with similar customer groups.
These insights, combined with earlier work on segmentation and value mapping, help refine a dynamic pricing approach that adapts to customer needs and market conditions.
Final Checklist
Checklist for Value-Based Pricing
To implement value-based pricing effectively, start by focusing on key metrics. Understand your customer segments and their willingness to pay by analyzing indicators like Customer Lifetime Value (LTV), Net Promoter Score (NPS), and Segmented Average Revenue Per User (ARPU). Make sure your product features align with measurable value drivers, such as specific usage metrics that are relevant to your customers.
Evaluate your pricing metrics based on how well they align with value, their simplicity, ease of measurement, and predictability. Stick to one primary metric to avoid unnecessary complexity. Test your chosen metric through pilots or A/B testing across different customer segments to confirm its effectiveness. This step is critical for fine-tuning your pricing strategy.
Once your pricing model is live, keep a close eye on key performance indicators like win rates, sales cycle length, ARPU, Net Revenue Retention (NRR), expansion revenue, churn rates, and billing-related support tickets. In a healthy SaaS business, churn typically falls between 5–7%, while an ideal LTV to Customer Acquisition Cost (CAC) ratio is around 3:1. Use cohort analysis to group customers by signup date or pricing tier, helping you track trends in retention and expansion revenue over time. Tools like Baremetrics can simplify this process by integrating with payment platforms like Stripe or Chargebee. These tools provide real-time insights into metrics like Monthly Recurring Revenue (MRR), churn, cohort performance, and revenue forecasting - all crucial for refining your pricing approach.
Make it a habit to review these metrics regularly and adjust your pricing tiers based on the data. If a particular customer cohort shows outstanding results - like high expansion revenue or low churn - dig deeper to understand what’s driving their success. Then, see if you can replicate those conditions across other segments. Keep your pricing strategy flexible by staying attuned to customer feedback and market trends, treating it as an ongoing process rather than a one-time setup.
Value-Based Pricing: Lessons from 20k+ SaaS Companies - Patrick Campbell, Founder & CEO, ProfitWell