Table of Contents

Every SaaS founder running on Stripe has the same moment. Someone asks a question that sounds simple like what's our churn by plan or are we retaining better than last year, and the answer isn't in the Stripe dashboard. The data exists. It just isn't a number anyone can read.
Founders describe the same two things on calls: Stripe is confusing for this, and getting a full picture means checking three places.
Founders and ops leads usually arrive here tired of:
- Seeing revenue arrive without ever learning why MRR moved — what was new, what expanded, what quietly churned
- Rebuilding a spreadsheet every time someone asks for churn by plan or LTV by cohort
- Knowing failed payments are costing money without being able to put a figure on it
- Being told the answer is SQL, when nobody has time to learn SQL
- Running multiple Stripe accounts with no single view across them
Want the dashboards without the SQL? Baremetrics connects to Stripe in one click and backfills your full history — about 30 minutes to a complete metrics suite. Start a free trial or book a call.
How Stripe's definition impacts churn calculations.
What Stripe's dashboard already does
A lot of comparison content undersells Stripe, which is the fastest way to lose a reader who uses it daily. Here's what the built-in dashboard actually covers.
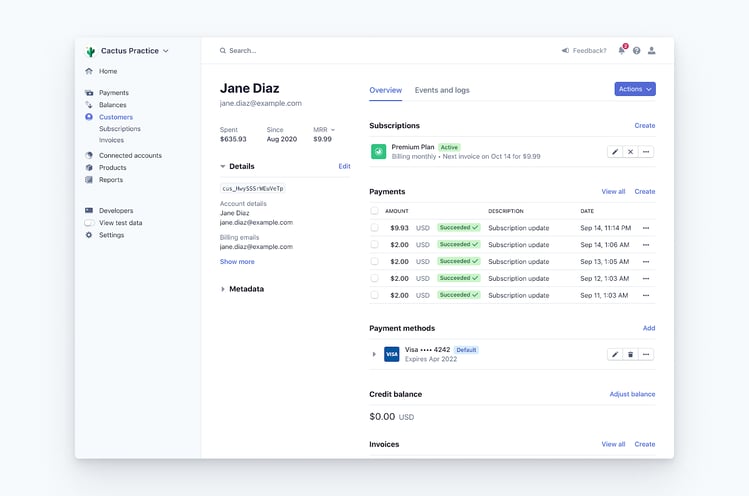
Stripe's customer subscription overview
Stripe's built-in dashboard is free with every account and covers:
- Revenue overview — gross revenue, net revenue, refunds, disputes
- Payment volume and trends — charted by day, week, or month
- Subscription overview — active subscriptions, trial counts, basic cancellation counts
- Top-line MRR — Stripe Billing auto-calculates it, provided your subscription objects are set up correctly, for Stripe-native subscriptions
- Customer list — full transaction history, subscription status, payment methods
- Payment success rate and payouts
- Radar — fraud signals and card blocking
For payment operations, this is genuinely good, and for a pre-revenue or very early product it may be all you need. If your only question is how much money came in, stop reading and save your money.
Where it stops
The wall is specific. Stripe's dashboard does not natively calculate:
- MRR movement broken out — New, Expansion, Reactivation, Contraction, Churned. This is the big one. You see the net number, never the composition.
- Revenue churn separated from customer churn — losing ten $10 customers and one $100 customer are very different events
- Customer lifetime value
- Cohort retention tables
- ARPU trends
- At-risk revenue from expiring cards
- Segmentation by plan, country, billing cadence, or custom attribute
- Multi-source normalization — Stripe plus Apple plus Google Play into one MRR
One more thing worth knowing: Stripe's MRR figure is often reported as 75–85% accurate against actual recurring revenue, due to timezone normalization, proration edge cases, and how trial conversions get handled. That's a third-party estimate rather than a Stripe figure, so treat it as directional. But it explains why your Stripe MRR and your own books rarely agree exactly.
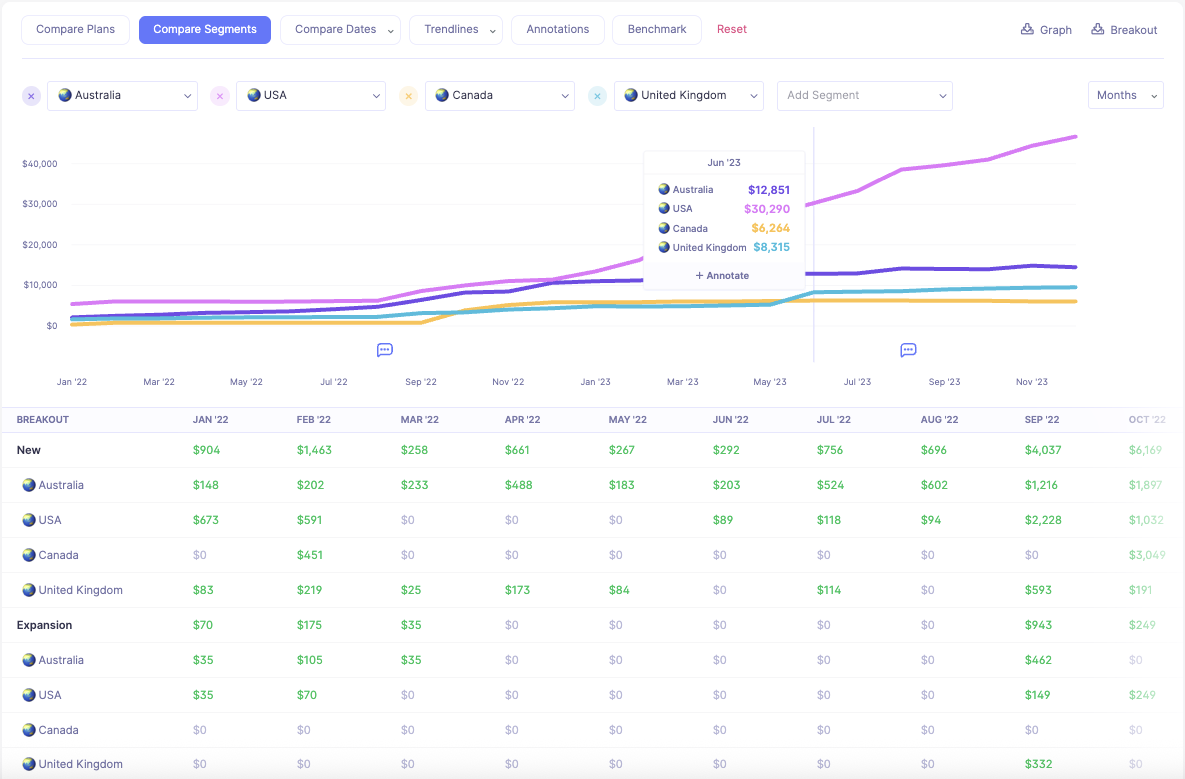
Segmentation by country in Baremetrics
Most companies hit this wall somewhere around $20–30K MRR, when cohort analysis, deep segmentation, or LTV by plan stops being a nice-to-have.
Option 1: Stripe Sigma
Sigma is Stripe's SQL environment, built into the dashboard. It's the most powerful option on this list if you have the skills to use it.
What it does well:
- SQL access to every Stripe object — subscriptions, invoices, customers, charges, payouts
- Pre-built query templates for common SaaS metrics, including MRR trends, churn analysis, and cohort tables
- An AI assistant that writes SQL from plain-English prompts
- Scheduled queries that run daily, weekly, or monthly with results emailed as CSV
- Saved, shareable queries and basic charts from results
Pricing: charge-volume based, free in sandbox, with a 30-day trial.
- Up to 250 charges/month — $15/mo monthly or $10/mo annual
- Up to 2,500 charges/month — $60/mo (annual only above 250 charges)
- Up to 10,000 charges/month — $225/mo
- Up to 25,000 charges/month — $450/mo
- Overage rates apply above each threshold
It's also included free with a Stripe Data Pipeline subscription.
Where it stops:
- It requires SQL. This is the whole ballgame for most readers. Without an analyst, you're blocked.
- Stripe data only. No Apple App Store, Google Play, Braintree, or Recurly. No normalization across sources.
- No pre-built dashboards. You get exactly what you write. Nothing is waiting for you.
- No dunning, no cancellation flows, no financial forecasting. Sigma reports; it doesn't act.
- Limited visualization. No custom dashboards, no embedded reporting, no scheduled chart digests.
- Stripe-locked. Change billing providers and your queries are worthless.
Best for: teams with a dedicated analyst or data engineer, running Stripe only.
Option 2: Stripe Data Pipeline plus BI
If you already run business intelligence tooling, Data Pipeline syncs Stripe data into your warehouse and you build dashboards there.
Direct integrations cover Snowflake, Amazon Redshift, and Databricks. Cloud storage destinations cover Amazon S3, Google Cloud Storage, and Azure Blob Storage — BigQuery is reachable via Google Cloud Storage rather than directly. A Data Pipeline subscription includes Sigma access.
Best for: data-mature teams with a warehouse, a BI tool, and someone to own the models. This is a real Stripe advantage and something Baremetrics doesn't offer — we have no data warehouse export.
Where it stops: it's infrastructure, not answers. You're buying pipes and building everything downstream yourself. Also Stripe-only, and it does nothing about failed payments or cancellations.
Option 3: Spreadsheet exports
The path most founders take first, and the one most of them abandon.
Export charges and subscriptions to CSV, build formulas, refresh manually. It works, and it costs nothing but time. The problems compound: it's a snapshot rather than live data, you're starting from raw transactions rather than SaaS metrics, and the model breaks the moment your pricing changes or someone pastes over a formula.
Best for: a one-off analysis. Not a system.
Option 4: A dedicated analytics layer
This is the option where the dashboards already exist and you don't build anything.
![Baremetrics Dashboard [2026]](https://baremetrics.com/hs-fs/hubfs/Baremetrics%20Dashboard%20%5B2026%5D.png?width=749&height=391&name=Baremetrics%20Dashboard%20%5B2026%5D.png)
Main 'Control Center' view in Baremetrics
Baremetrics connects to Stripe in one click and backfills your full history. It takes about 30 minutes to a complete metrics suite and comes with pre-built metrics. It also reads Braintree, Chargebee, Recurly, Shopify, the Apple App Store, and Google Play, normalizing everything into one MRR you can still segment by source.
The MRR movement breakdown Stripe doesn't produce
New, Expansion, Reactivation, Contraction, and Churned, with net change by day, week, month, or quarter. Every movement clicks through to the individual customer and the event behind it.
![Baremetrics MRR waterfall [Screened in]](https://baremetrics.com/hs-fs/hubfs/Baremetrics%20MRR%20waterfall%20%5BScreened%20in%5D.png?width=2404&height=590&name=Baremetrics%20MRR%20waterfall%20%5BScreened%20in%5D.png)
A close-up of the MRR movement breakdown in Baremetrics
This directly answers the question Stripe can't. Say your MRR grew $400 last month. Was that $4,000 of new business against $3,600 of contraction, or a quiet month with one big upgrade? Those are opposite situations and Stripe shows you the same number for both.
Annotations let you mark pricing changes, campaigns, or outages directly on the graph, so in six months you can still explain the spike.
Churn by plan, and every other segment
Churn by plan is usually the first question a single number can't answer, and Stripe doesn't break it out.
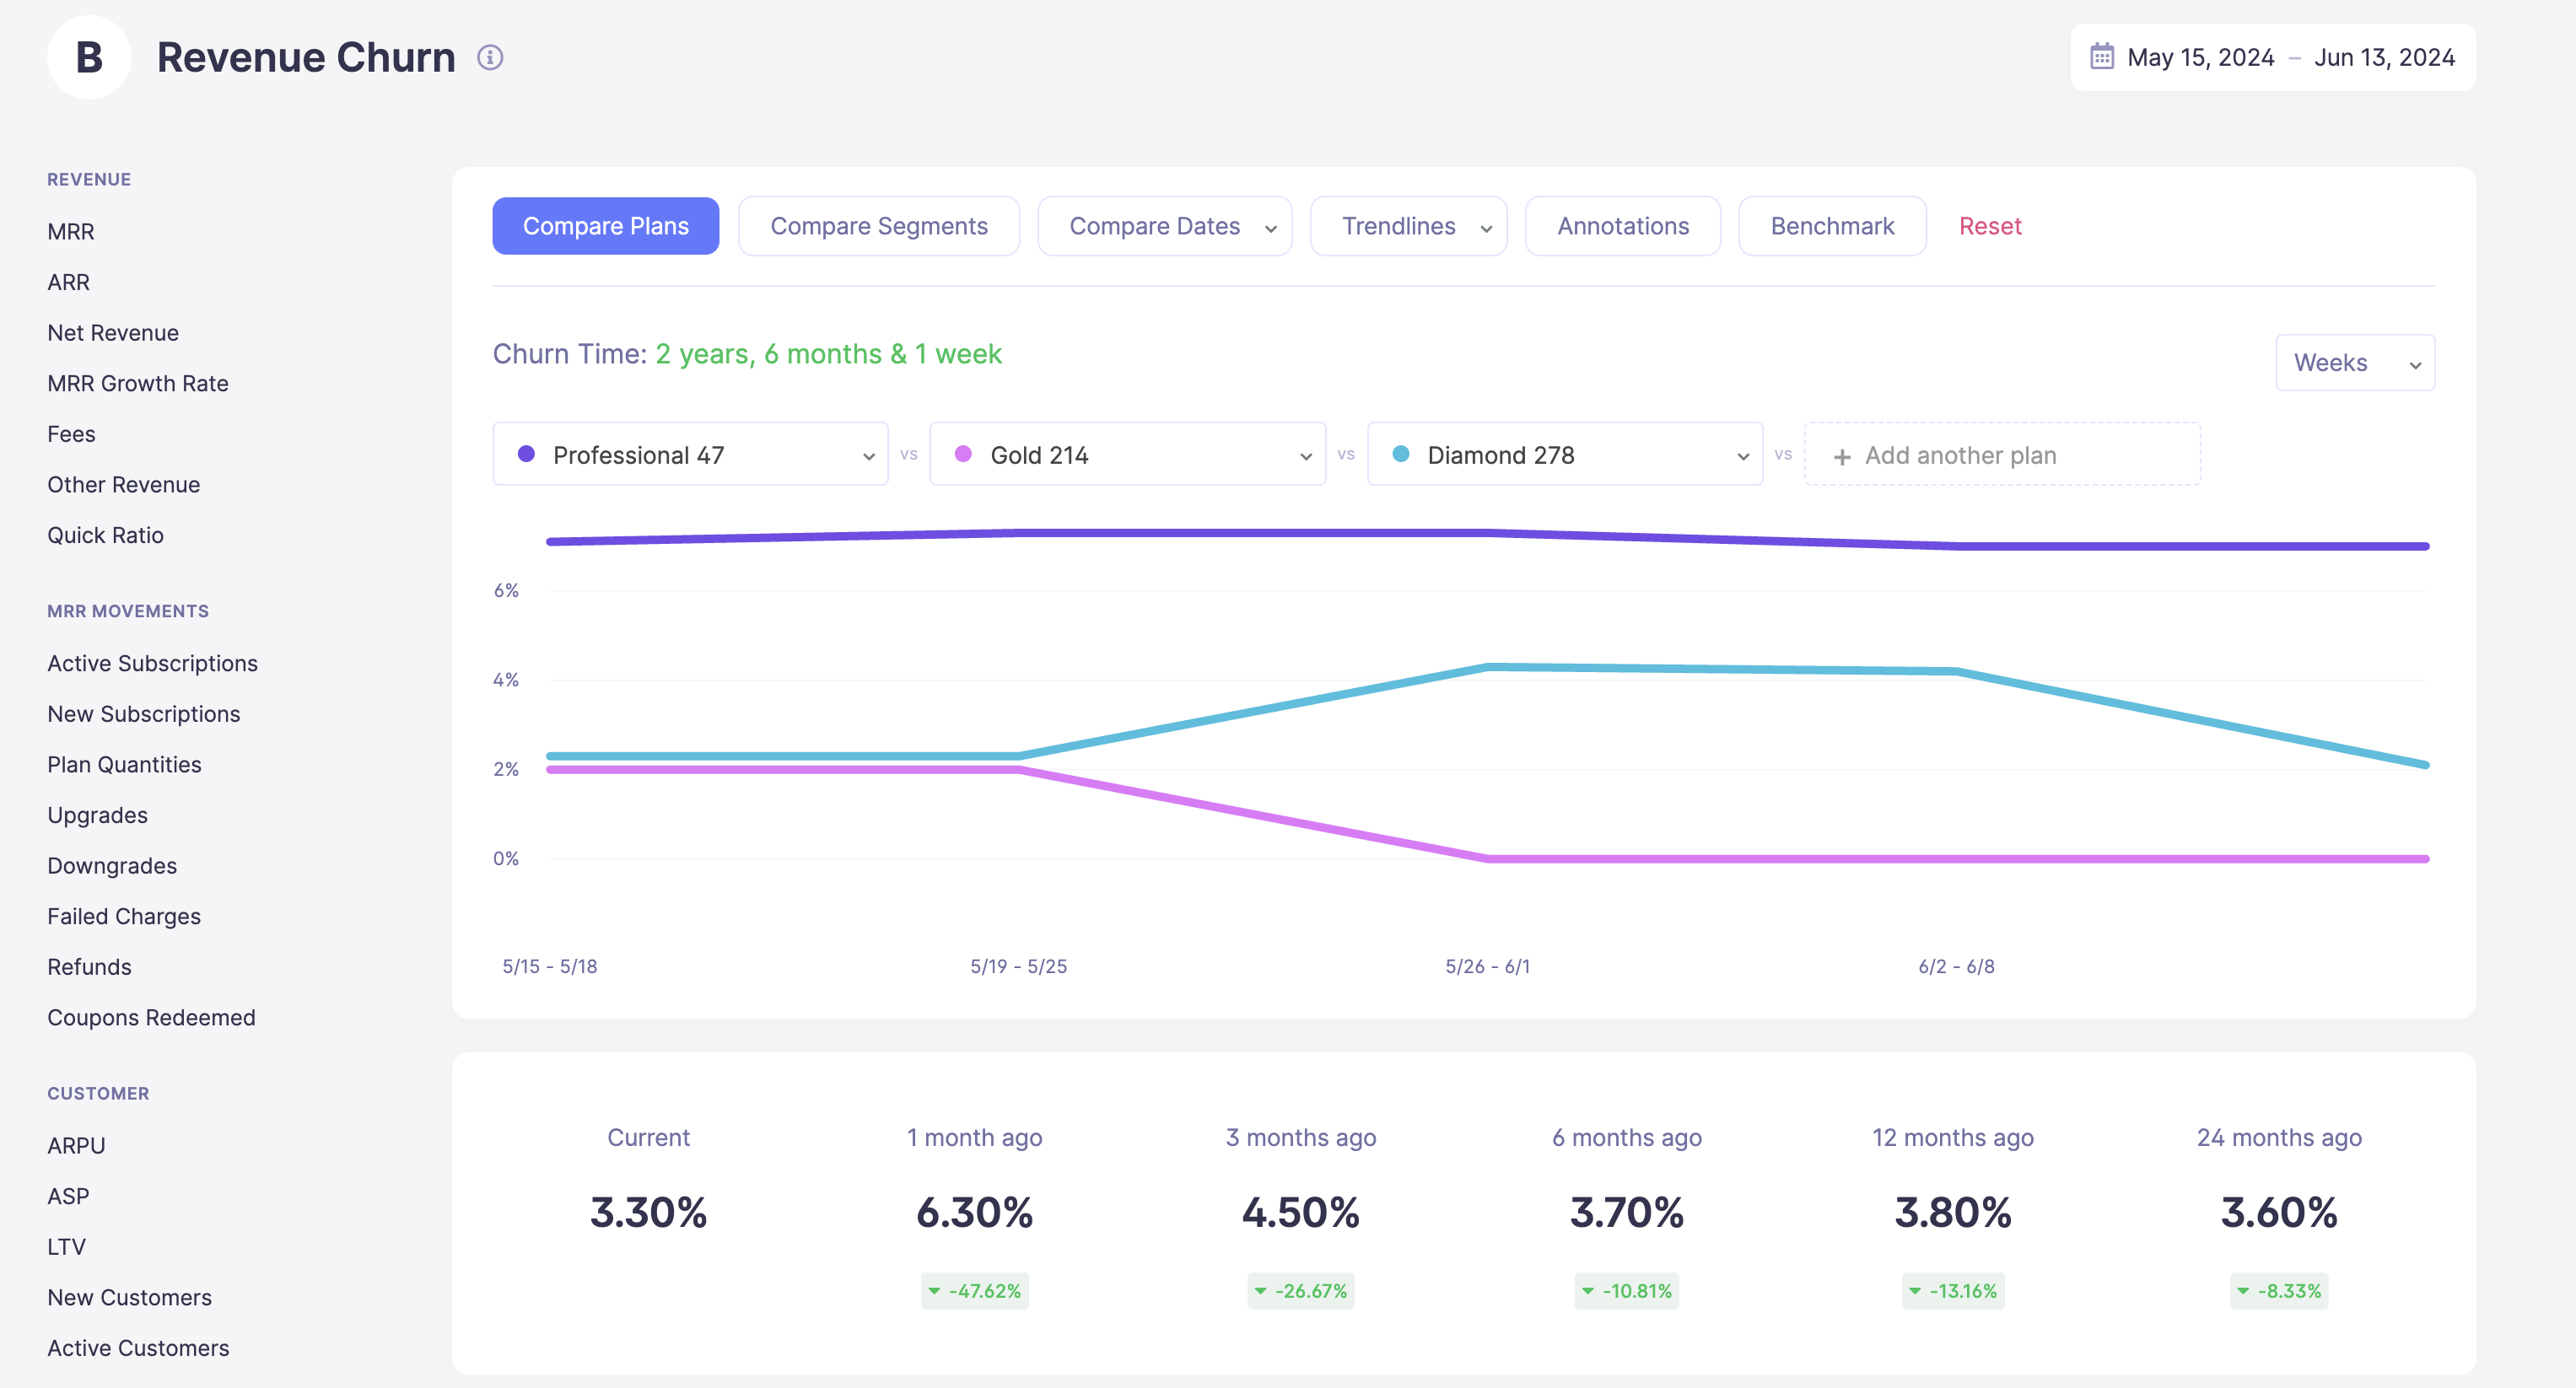
Churn by subscription plan in Baremetrics
Unlimited segments on any attribute, including plan, country, billing cadence, price point, Stripe metadata, custom attributes pushed via API, or synced HubSpot and Intercom fields. In Baremetrics, you're able to stack multiple filters at once, save each view as its own dashboard, and overlay segments on the same graph. The sky is the limit on the segments or dashboards created within your account.
Cohort retention tables, live
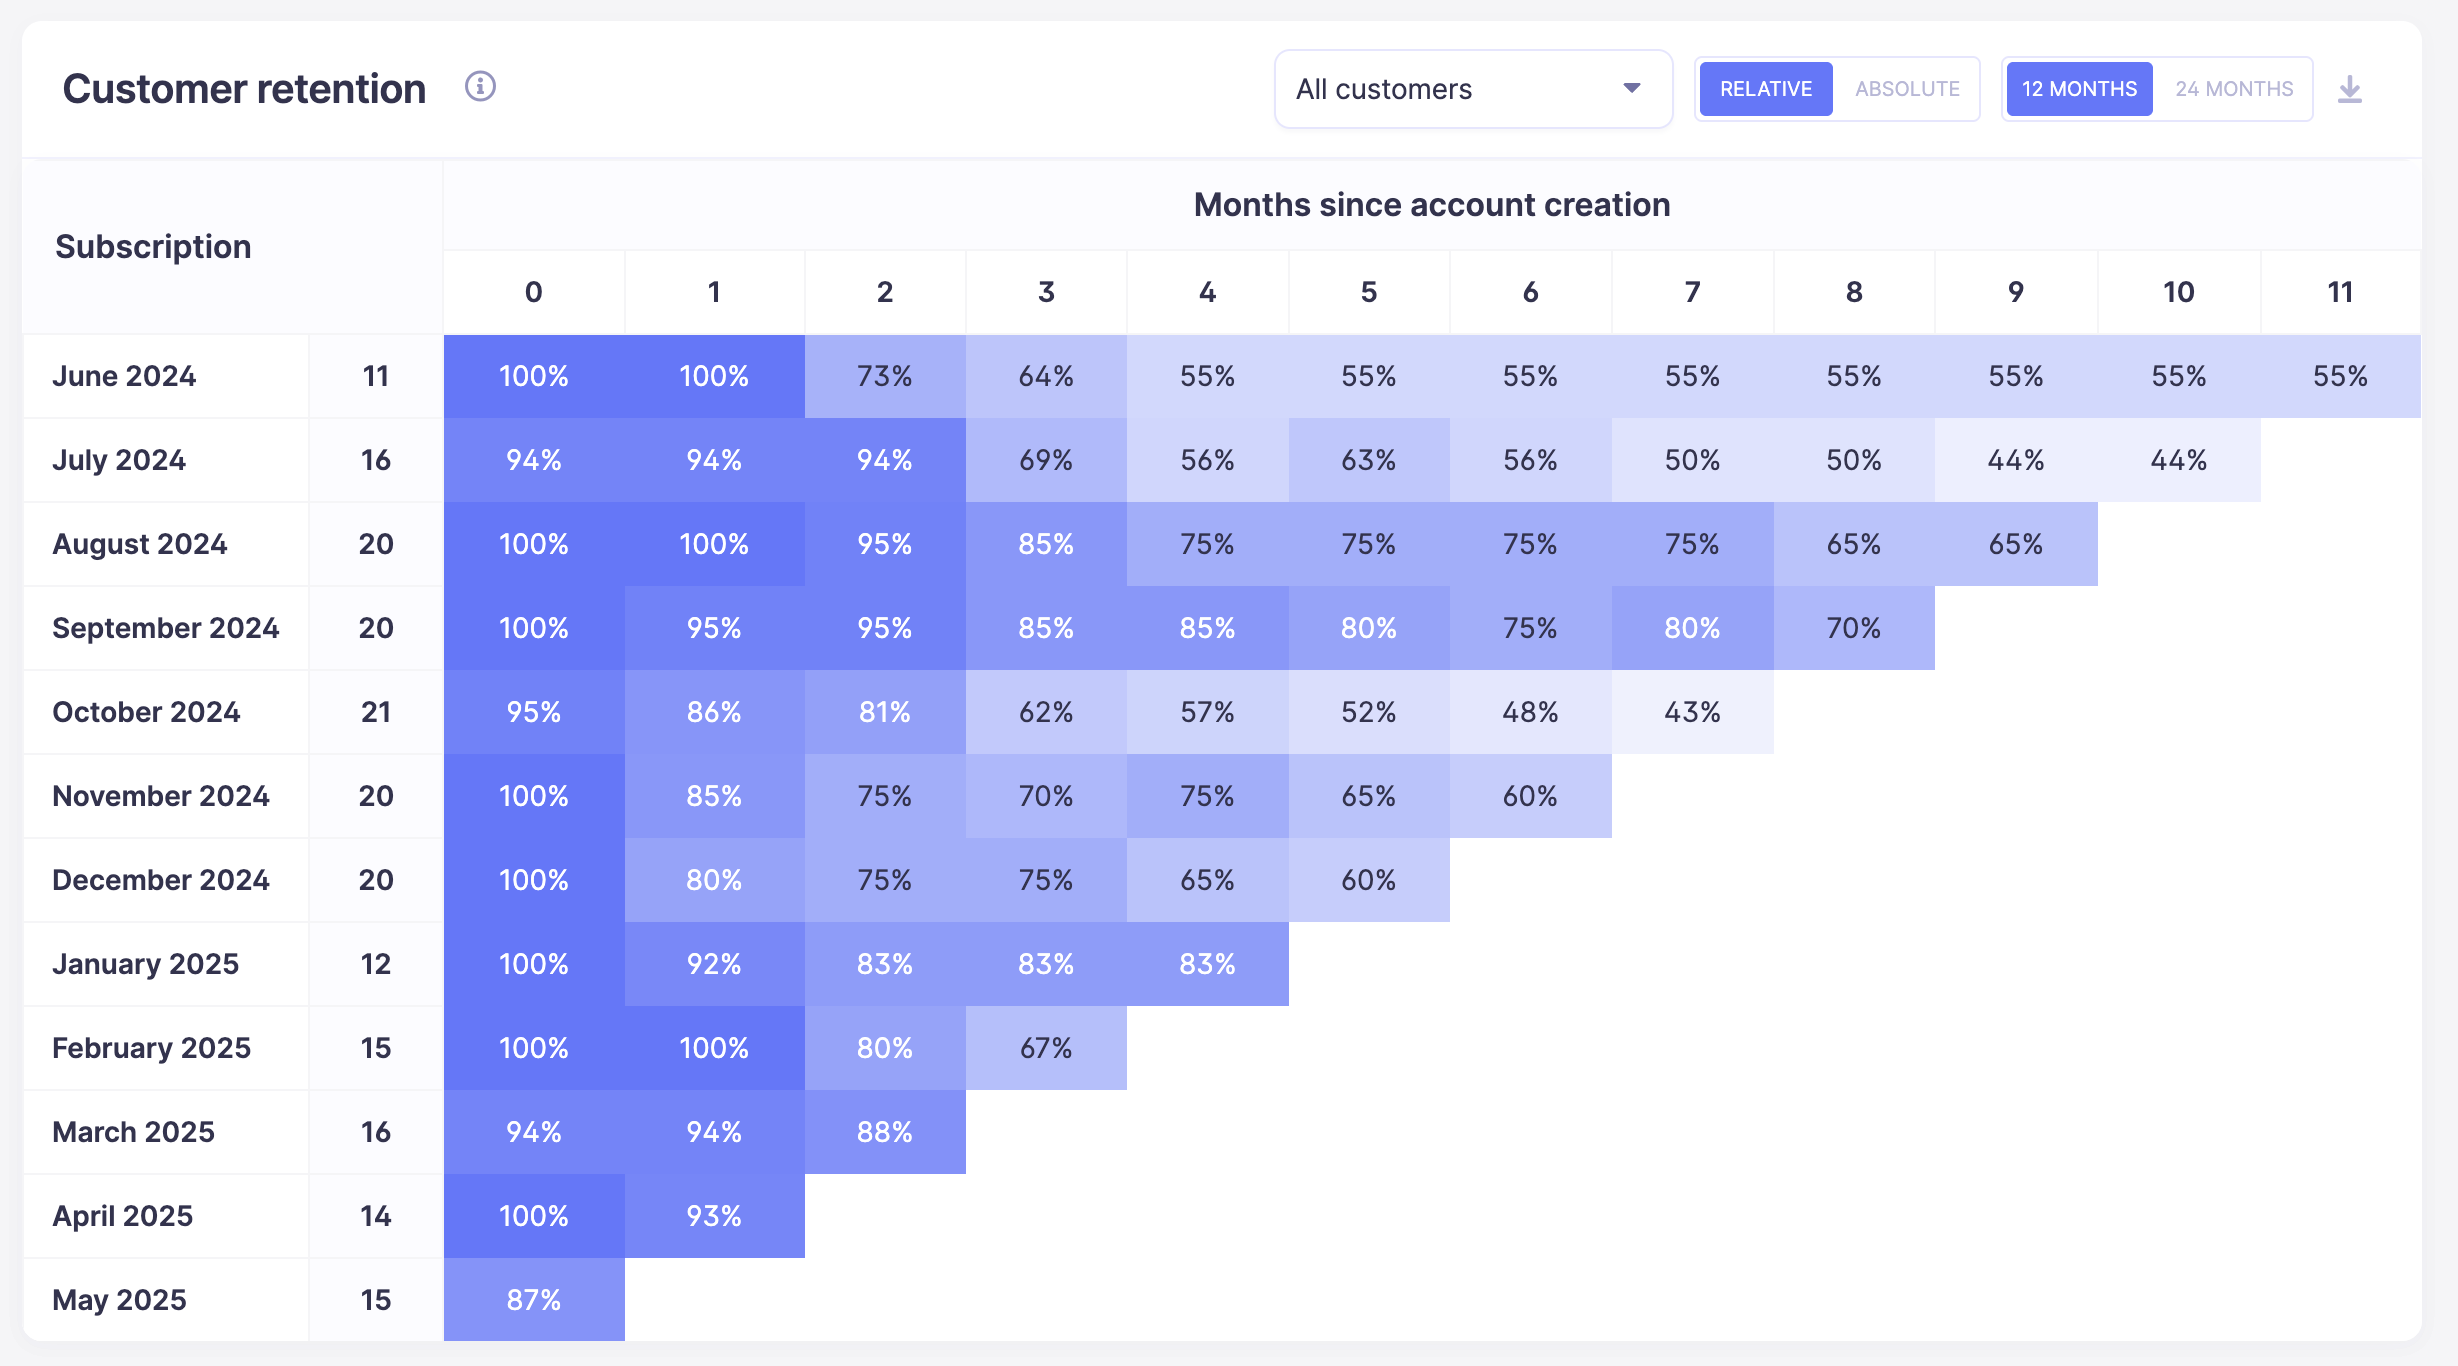
Cohort retention tables in Baremetrics
Cohort retention tables are built into Baremetrics, with no SQL queries required. Month-by-month retention by cohort, so you can see whether you lose people in month one or month six. This is crucial for founders because it changes where you aim your retention effort entirely.
Recover: the failed payments you can currently only guess at
Keep Stripe Smart Retries turned on. It's genuinely good ML retry logic — default 8 attempts over 2 weeks, configurable anywhere from 1 week to 2 months, with segment-specific policies through automations. It handles charge timing, and nothing here replaces it.
What Stripe doesn't do is customer communication you control. Stripe Billing can send failed-payment emails, but they're Stripe-branded templates with minimal copy control, email-only, and not a sequenced campaign.
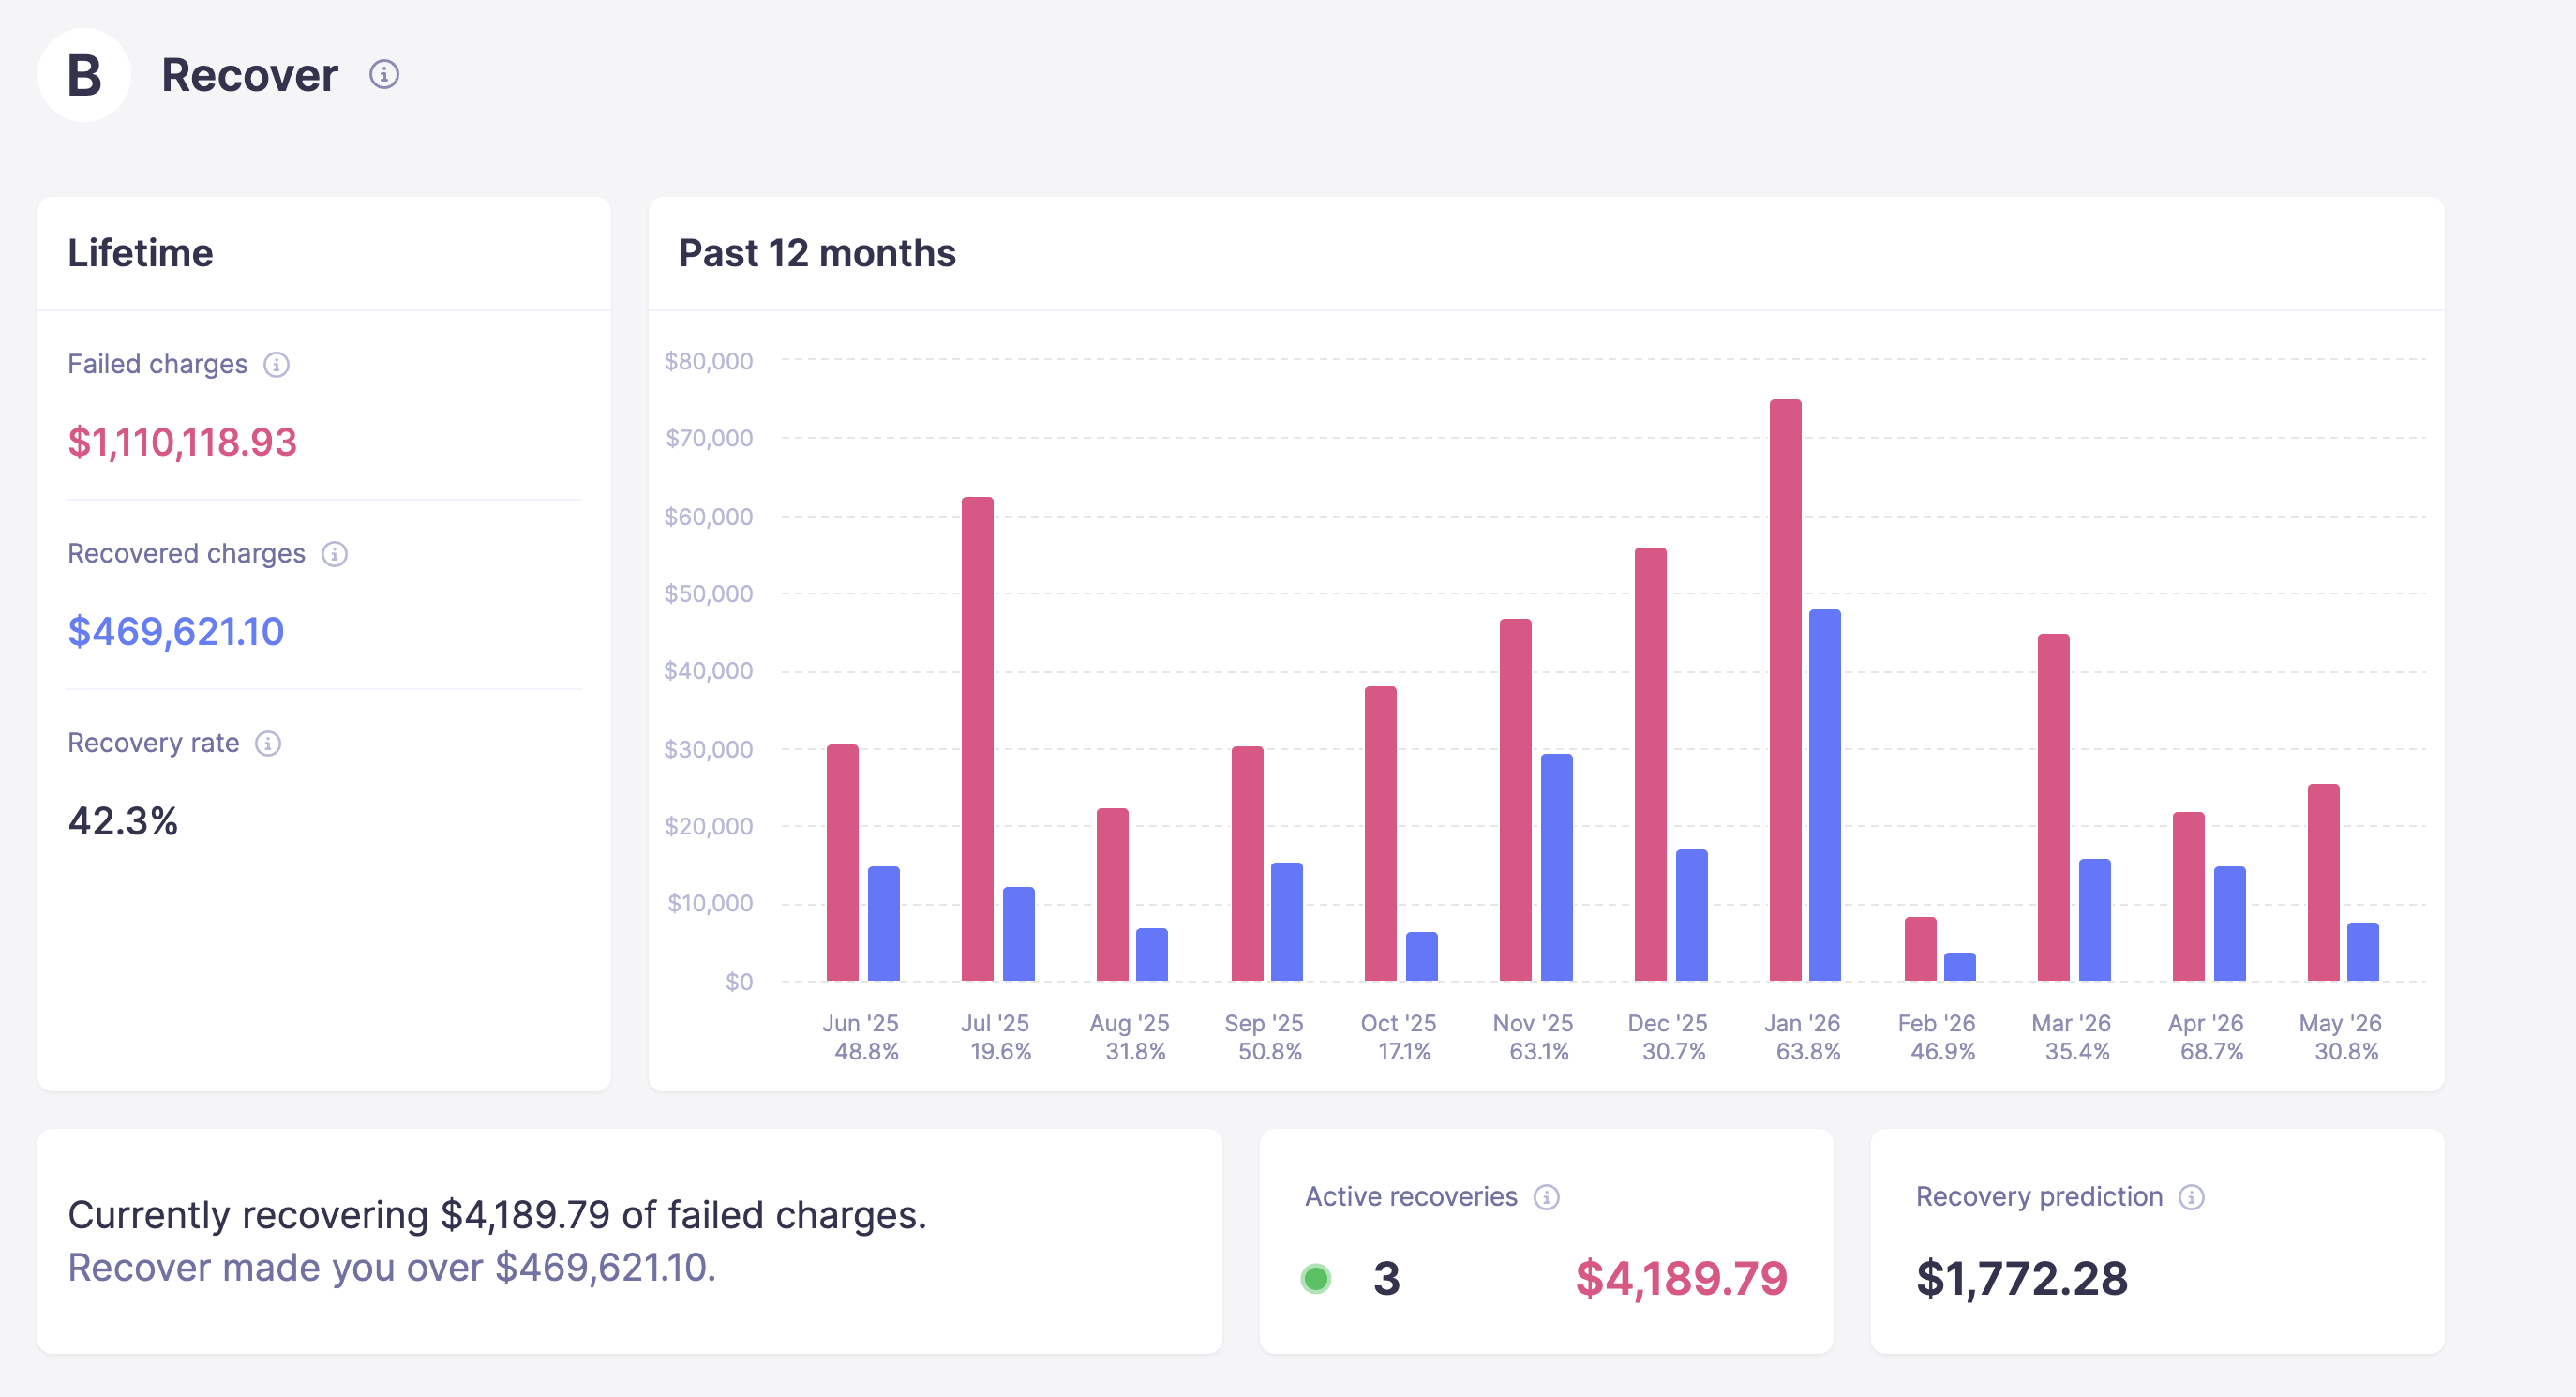
Recover dashboard in Baremetrics
Recover adds that layer on top of Smart Retries:
- Up to seven fully customizable emails — you write sender, subject, body, timing, sequence
- Card expiration warnings at 30 and 7 days before expiry, plus annual renewal reminders — catching failures before they happen
- A branded billing widget with your logo and colors; the card updates straight into Stripe and Baremetrics never stores card data
- In-app banner into paywall after a grace period you set
- SMS recovery, billed per message, alongside email
- A recovery dashboard — failed charge volume, recovery rate, and per-email open, click, and recovery performance
For scale: across active Recover accounts in May 2026, the internal dataset (133 companies) recorded $1,241,070 recovered, 11,008 charges recovered from 125,150 dunning emails, an average recovery rate of 14.9% of failed charges, and 120 of 133 accounts recovering at least some revenue that month. Per our May 2026 recovery benchmark, the median customer earns back roughly 8× Recover's cost within a month. That's one month and one cohort, not a universal average, but it's the real number.
Worth sizing the problem generally too: Stripe-partnered benchmark data from Churnkey puts involuntary churn at roughly 22% of total SaaS churn. Recover is $129/month flat, with no commission on recovered revenue.
Cancellation Insights: why people actually leave
Be clear about what Stripe already does here, because it's more than most articles admit. Stripe's hosted customer portal can collect a cancellation reason (from a fixed list of 8 options plus free-text "Other") and can show one generic retention coupon at the point of cancellation.

Save offers in Cancellation Insights
The gaps are what matter:
| Stripe portal | Cancellation Insights | |
| Collect a reason | Yes — 8 fixed options | Yes — fully customizable list |
| Aggregate dashboard | No — per-subscription only | Yes |
| Export | No | Yes |
| Reason-based save offers | No — one generic coupon | Yes — Retention Offers, auto-applied to the Stripe subscription (discount-only today) |
| Reason-based win-back emails | No | Yes |
| Works in your own cancel flow | No — portal cancellations only | Yes |
Cancellation Insights is $129/month, with Retention Offers included at no additional cost. Today they're discount-only, with any discount applied automatically to the Stripe subscription; pause and trial extension are coming soon.
Forecast+: runway and burn, included
Neither Stripe's dashboard nor Sigma touches this. Forecast+ connects natively to QuickBooks Online or Xero — or takes a CSV — and ingests your P&L line by line, producing runway, burn rate, bank balance, expense breakdown by department and fixed vs. variable, net profit margin, CAC, and budget variance against plan. Scenario planning models Target, Base, and Worst Case side by side.
It's included free with any paid Metrics plan, not sold separately.
Support
Stripe support is docs and tickets. Baremetrics includes unlimited onboarding calls with no cap during trial or after, live chat with a real person usually answered within minutes, and working sessions where the team builds your segments and recovery flows with you.
See it against your own Stripe data. One click, full history backfilled, about 30 minutes. Start a free trial or book a call.
Running multiple Stripe accounts
This is a common setup where companies have one Stripe account per product, region, or entity, and both Stripe and Baremetrics have an answer. They're genuinely different.
Stripe Organizations lets you manage multiple accounts under one umbrella, view consolidated financial metrics, download consolidated reports, and run Sigma for Organizations to write cross-account SQL grouped by merchant_id. Note that Sigma must be enabled and paid for on each account included in a query.
Baremetrics connects each Stripe account through Data Connections, roughly 5 minutes per account, into one dashboard with unified MRR, churn, and LTV, without the need for SQL. Multi-currency conversion is handled automatically, normalizing into a single reporting currency.
| Baremetrics | Stripe Organizations + Sigma | |
| Setup | ~5 min per account via Data Connections | Enroll in Organizations; enable Sigma per account |
| Unified MRR / churn / LTV | Pre-built, no SQL | Must be queried manually |
| Per-account metric breakdowns | Limited — not available on all graph views | Clean, via GROUP BY merchant_id |
| Cross-account SQL | Not available | Full, via Sigma for Organizations |
| Non-Stripe sources in the same view | Apple, Google, Braintree, and more normalized alongside Stripe | Stripe only |
| Failed payment recovery | Recover covers all connected Stripe accounts | Not available |
| Financial forecasting | Forecast+ across all sources | Not available |
| Cost | Plan covers all connected accounts | Sigma paid per account in the org |
The honest read: if your primary need is cross-account SQL reporting and you have the technical resources, Sigma for Organizations does per-account isolation better than we do. Baremetrics wins on pre-built dashboards, dunning, forecasting, and non-Stripe sources in one view. If per-account isolation on every graph is a hard requirement, raise it early.
Comparison table
| Capability | Stripe dashboard | Stripe Sigma | Baremetrics |
| Top-line MRR | Yes (Stripe Billing) | Queryable | Yes, re-processed |
| MRR movement waterfall | No | Buildable in SQL | Pre-built, daily |
| Revenue vs. customer churn | No | Buildable | Pre-built |
| LTV / ARPU trends | No | Buildable | Pre-built |
| Cohort retention tables | No | Buildable | Pre-built |
| Segmentation | No | Via SQL group-by | Unlimited + saved dashboards |
| Multi-source normalization | No | No | Yes — 7 native sources + API |
| Financial forecasting (runway, burn, CAC) | No | No | Forecast+, included with paid plans |
| Failed payment retries | Smart Retries | No | Use alongside Smart Retries |
| Branded, sequenced dunning | Limited — Stripe-branded, email only | No | Recover — 7 custom emails, widget, paywall, SMS |
| Cancellation reasons | Portal, 8 fixed options | Queryable | Custom list + dashboard + win-backs |
| Reason-based save offers | One generic coupon | No | Retention Offers, auto-applied (discount-only today) |
| SQL / custom reporting | No | Full Stripe SQL | Not available |
| Data warehouse export | Via Data Pipeline | Included with Data Pipeline | Not available |
| Fraud tooling | Radar | n/a | Not available |
| Requires SQL | No | Yes | No |
| Setup time | Zero — already there | Varies; needs SQL skill | ~30 minutes |
| Support | Docs, tickets | Self-serve | Unlimited calls, chat in minutes |
| Price | $0 | $10–450/mo by charge volume | From $49/mo (Launch, annual) |
What Stripe does better
Stating this plainly, because a page that pretends Stripe has no strengths isn't worth trusting.
1. SQL-level custom reporting. Sigma out-flexes any pre-built tool. You can query anything in Stripe's data model. Baremetrics has no SQL layer at all.
2. Data warehouse integration. Data Pipeline syncs to Snowflake, Redshift, and Databricks directly, plus S3, GCS, and Azure. For data-mature teams running BI, that's a real advantage. We don't offer warehouse exports.
3. Zero cost for basic reporting. Stripe's dashboard is free. Our entry point is $49/month on Launch with annual billing.
4. Stripe is the source of truth. Every analytics tool, ours included, processes a derived view of Stripe's data. Sigma queries the source — no sync lag, no transformation layer.
5. Fraud prevention and payment optimization. Radar, adaptive acceptance, and the card account updater are Stripe-native and not replicated in any analytics product. We don't compete here.
How to choose
Stripe's dashboard alone if you're pre-revenue or under $10K MRR, you need payment volume and subscription counts, and segmentation, cohorts, and LTV genuinely aren't questions yet.
Stripe Sigma if you have an analyst or data engineer who knows SQL, you're Stripe-only, and you want maximum flexibility over pre-built convenience.
Data Pipeline plus BI if you already have a warehouse, a BI tool, and someone to own the models.
Baremetrics if you're at $20–30K MRR or beyond and need pre-built SaaS metrics without SQL, you run multiple payment sources or multiple Stripe accounts, you want runway and burn from your actual P&L, you need branded sequenced dunning rather than just retry timing, or you want a team that will build the dashboards with you.
And the combination most companies land on: Stripe for payments and fraud, Smart Retries left on, and an analytics layer on top. These aren't really competing products.