Table of Contents

Key takeaways:
- Stripe’s analytics only provides baseline data for balance payout and reconciliation, with basic metrics regarding growth, monthly recurring revenue, and retention
- Stripe’s data limitations can prevent SaaS and subscription businesses from making the best revenue-boosting decisions for their businesses
- With our Stripe integration, Baremetrics creates the best Stripe analytics dashboard to help you dive deeper into the metrics that matter
- Baremetrics also provides new functionality like MRR movements, dunning processes, cancellation insights, people insights, customer profiles, and more
Stripe is a payment processing company that also comes with basic financial reporting. Close to 2 million websites use Stripe, holding an 18.54% market share in the payments processing category.
While Stripe is a great payment processing tool, however, its reporting features aren’t as advanced. In this post, we’ll discuss the limitations of Stripe’s reporting and why SaaS businesses use Baremetrics' Stripe integration (seen below) for more detailed financial analytics, forecasting, and more.

A dashboard in Baremetrics
The Value of Stripe Reports
Stripe can provide standard financial reports to reconcile transactions and activity in your account. A dashboard displays a summary, which you can download as an itemized account (in CSV format).

A dashboard in Stripe
What Information Do Stripe Financial Reports Show?
Stripe has two main financial reporting tools: Balance and Payout Reconciliation. These tools help you create reports of your transaction history, payments.
1. Balance Report
The Stripe Balance Report provides a CSV report of your transaction history and other custom data associated with those transaction. It’s similar to a bank statement and useful for companies that use Stripe like a bank account to make manual payouts.
You can use your Stripe Balance Report to reconcile your balance at the end of every month.
2. Payout Reconciliation
You will use this report if you enabled automatic payments and want to reconcile transactions settled in each payout. The Payment Reconciliation report matches payouts with batches of payments and other related transactions.
Stripe Transaction Reports
There are two primary Stripe transaction reports: the Balance Report and the Payment Reconciliation Report.
The Balance Report shows your itemized transaction history. It’s a CSV file that you can use in manual accounting.
The Payment Reconciliation Report is a summary of your transactions within a specific date range.

A Stripe DOCS dashboard
What Metrics Are Calculated in Stripe?
Stripe measures several metrics relevant to Saas businesses. The metrics are included under the Growth, Retention, Subscriber Information, Product and Collections Information categories.
1. Growth
Stripe displays your Monthly Recurring Revenue (MRR), MRR Growth, Net revenue, and New Subscribers for specific periods. If relevant, you can also view your MRR per product and per plan. The downside is that Stripe may include trial users in its MRR calculations, which could inflate your data.
2. Retention
Stripe gives you access to your subscriber churn rate, churned revenue, and subscriber retention, and revenue retention by cohort.
3. Subscriber Information
Use Stripe to view your Average Revenue per Subscriber (ARPS), Lifetime Value (LTV), Top Subscribers, and Recently Churned Subscribers. You can also see your total billing history.
4. Product Information
This allows companies to view monthly recurring revenue by product or service plan, depending on the nature of their business.
5. Collections Information
Stripe will give you insight into Recovered Revenue and Outstanding Invoices.
Stripe Custom Reports
If you are technically adept and understand data analytics, you can create custom reports that reveal data for charges, refunds, disputes, and others with Stripe Sigma. Sigma is a customizable SQL tool that allows users to write queries and track how metrics change over time.
Anyone can create or edit a query via a template. Clients can generate a custom report detailing recurring revenues per month or per year, average revenue per customer, or even how many invoices remain unpaid. It’s an excellent tool for companies that do not like pre-packaged reports.
Stripe Monthly Reports
You can download all your account activity grouped by month up to the last full day, including charges, refunds, fees, etc. You can go through this via the Stripe dashboard. Alternatively, you can filter and export all transactional data as a CSV or download a monthly report or QuickBooks-formatted export via your account’s business settings.

Source: Stripe DOCS
What Metrics Does Stripe Not Show?
Stripe has many excellent reporting features, and the dashboard displays essential information, but there are a few blind spots in their reporting that you may want to supplement.
1. Forecasting
MRR Growth Rate is a great metric, but manual forecasting isn’t easy. Stripe will display your MRR, but it won’t provide a revenue forecaster.

Baremetrics' Forecast+ dashboard
2. MRR Movements
You can view new and active subscriptions with a click of a button with Stripe reports, but you can’t drill down and distinguish between plan quantities, upgrades, downgrades, failed charges, or refunds with the same ease. As dunning management is a crucial part of your SaaS business, you may want to look for an additional automation tool that integrates directly with your reporting.

MRR movements in Baremetrics
3. Churned Subscriptions or Cancellation Insights
You can view Churn Rates in Stripe (based on revenue), but it doesn’t display downgrades versus actual cancellations. You can see customers leaving, but not why they are churning. It’s tough to drill down into customer metrics and motivation.
Discover how Stripe customers can calculate churn with Baremetrics.
4. Trials
Stripe doesn’t make distinctions about customers using a trial version of your software solution.
5. Customer Profiles and People Insights
Stripe reports contain very little information about customers, and it’s not possible to augment information using third-party data. As a SaaS company, you might want deeper profiling information.
6. Benchmarking
Benchmarking helps companies gain an independent perspective about the company and how well they compare in terms of performance and delivery to the competition. Your benchmarks are a great sales tool when pitching to clients and investors. With Stripe, you cannot compare your Stripe metrics to other companies of your size and scope.
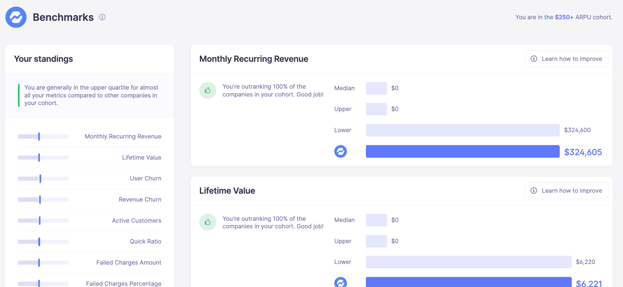
Baremetrics’ Benchmarking Tool
7. Segmentation
Stripe doesn’t allow for granular segmentation, e.g., looking at churned customers cross-referenced with the plan they are using. This can make it difficult to gauge which strategies are working and which aren’t.

Compare customer segments in Baremetrics
8. Customer Acquisition Costs
Customer acquisition costs (CACs) tell you how much you’re spending to acquire customers— and Stripe certainly doesn’t give you this information. You can, however, use tools like Baremetrics to calculate your customer acquisition costs for Stripe customers.

Customer acquisition cost in Baremetrics' Forecast+
9. Customer Lifetime Value
Customer lifetime value (LTV) is a vital metric that helps you assess the average value of a single customer across their relationship with your business. Some customer segments may have higher LTVs than others. This metric can helps you better predict revenue and make more informed decisions regarding marketing campaigns— including whether those CACs are worth it.
See how Stripe customers can calculate LTV with Baremetrics.

Baremetrics Provides Smarter Financial Reporting
Stripe provides basic reporting to help teams get started, but growing SaaS & subscription companies upgrade to Baremetrics for more depth, accuracy, and supplementary tools.
Baremetrics has many reports similar to Stripe, but in addition to focusing on the current financial situation, Baremetrics also focuses on forecasting your company’s financial future.
You can use Baremetrics’ templates to create multiple scenarios and even include variables that reflect the best and worst-case performance scenarios. You can also compare scenarios with actuals year after year to improve your accuracy and measure your KPIs.
Better financial reports enable better decision-making.
The Baremetrics toolkit lets you view more detailed data across customizable periods. Here are the tools that Baremetrics has that Stripe doesn’t.
1. Forecasting
The Forecasting tool allows you to make informed predictions and projections about your company’s future, including MRR projections, cash flow projections, and customer projections.

Baremetrics' Forecasting dashboard
2. In-Depth Reporting
The Reporting tool pulls data directly from Stripe or other payment processors and displays the information in easy-to-digest graphs and charts.
Baremetrics tracks 26 essential SaaS metrics, including Monthly Recurring Revenue (MRR), Annual Recurring Revenue (ARR), Net Revenue, and more.
You might also want to see summarized data in a quarterly or annual form instead of getting information overloaded for every day on your screen. After all, SaaS companies have many unique metrics and KPIs that can’t be communicated using only the three-statement structure of the Operating Model.
3. Trial Insights
Your trials are valuable tools for conversion. Baremetrics allow you to measure how customers behave during their trial. Are they using all the features? Are they logging in every day? If not, a quick phone call might help them find success – and sign on once the trial ends!
4. Enhanced Customer Profiles
Your customers form the backbone of your success. Baremetrics offers profound insight into your customers, right from your financial reporting dashboards. You can view your customers' location, lifetime value, and transactions.
Baremetrics also allows you to segment those customers any way you want. Want a glance at how many customers have signed on in your home base? Or which customers canceled this week? You can do it with the click of a button.
Baremetrics also has automated recovery tools to help reduce churn and recover failed payments – all on the same platform!
See Your First Report Today
Stripe is great for showing you the basics of your data, but it’s not enough to get a complete picture of what’s happening. With Baremetrics, you’ll see more in-depth information and access all the necessary metrics to help with better decision-making.
Baremetrics offers the best stripe analytics dashboard, sourcing all the key data and giving you the metrics that matter. Getting started is simple – check out our Stripe integration walkthrough to connect your account in minutes.


