
Table of Contents

For SaaS companies, success depends highly on using key metrics to track financial growth and enhance visibility into all the key performance indicators.
Another major interest is comparing one’s growth and performance with other companies in similar SaaS niches. For every decision-maker in a SaaS company, understanding SaaS financial benchmarks makes a proper interpretation of your internal performance metrics.
Key takeaways
- Baremetrics publishes free, live SaaS benchmarks on Open Benchmarks, split into six average-revenue-per-user (ARPU) cohorts and built from anonymized data from over 800 startups using Baremetrics.
- On Open Benchmarks (checked October 14, 2026), monthly user churn runs from 5.8% to 8.4% depending on the ARPU cohort, and monthly revenue churn runs from 5.6% to 8.8%.
- Revenue growth is 7.0% in four of the six cohorts, with 5.0% for companies under $10 ARPU and 8.0% for the $25–$50 cohort.
- Baremetrics guidance for a good monthly churn rate is 3–5% for SaaS companies that sell to small businesses and under 1% for enterprise products.
- For failed payments, the Baremetrics May 2026 benchmark of 119 US B2B SaaS companies found a median attempted recovery rate of 12.7%.

What is a good monthly churn rate for B2B SaaS?
A good monthly churn rate for B2B SaaS is 3–5% of customers if you sell to small businesses and under 1% if you sell enterprise contracts, according to Baremetrics' churn guidance. On Baremetrics Open Benchmarks, actual monthly user churn runs from 5.8% to 8.4%, so every ARPU cohort sits above the small-business target.
The gap between the target and the cohort data is the useful part. A company losing 4% of its customers each month is beating every cohort on Open Benchmarks, while a company at 8% is in line with the $25–$50 and $50–$100 cohorts but still well above the guidance.
The table shows the churn figures Open Benchmarks displayed for each ARPU cohort on October 14, 2026. User churn counts customers who cancelled. Revenue churn counts the MRR lost to cancellations and downgrades.
| ARPU cohort | Monthly user churn | Monthly revenue churn |
|---|---|---|
| Under $10 | 6.2% | 7.8% |
| $10–$25 | 5.8% | 7.1% |
| $25–$50 | 8.3% | 8.5% |
| $50–$100 | 8.4% | 8.8% |
| $100–$250 | 7.4% | 7.4% |
| $250 and up | 6.1% | 5.6% |
Churn does not fall in a straight line as ARPU rises. The lowest user churn is in the $10–$25 cohort (5.8%) and the highest is in the $50–$100 cohort (8.4%). Revenue churn is lowest in the $250-and-up cohort (5.6%), the only cohort where revenue churn sits below user churn.
Expect higher numbers early on. Baremetrics notes that most early-stage SaaS companies see churn of 10–15% in their first year while they work out what the product needs to do, and then bring it down quickly.
Two caveats apply before you compare. Open Benchmarks is drawn from Baremetrics customers, who are subscription and SaaS businesses of every kind, so it is not a B2B-only sample. Its user churn follows the Baremetrics definition: the share of customers who cancelled in the last 30 days. For the formulas, see how to calculate churn rate.
What are typical SaaS churn, growth and retention rates by ARPU?
On Baremetrics Open Benchmarks, typical rates are 5.8–8.4% monthly user churn, 5.6–8.8% monthly revenue churn and 5.0–8.0% revenue growth, depending on what a company charges per customer. The cohort figures below are as displayed on October 14, 2026, segmented by ARPU rather than by industry.
Baremetrics groups companies by ARPU because it shows how much a business charges per customer, which shapes how many customers it needs and how much each cancellation hurts. Find your ARPU band, then read across.
| ARPU cohort | Median MRR | MRR, lower to upper quartile | User churn | Revenue churn | Revenue growth | Lifetime value |
|---|---|---|---|---|---|---|
| Under $10 | $46,100 | $13,000 – $219,600 | 6.2% | 7.8% | 5.0% | $107 |
| $10–$25 | $44,400 | $19,800 – $179,600 | 5.8% | 7.1% | 7.0% | $256 |
| $25–$50 | $52,100 | $21,900 – $129,000 | 8.3% | 8.5% | 8.0% | $417 |
| $50–$100 | $44,900 | $15,800 – $123,400 | 8.4% | 8.8% | 7.0% | $885 |
| $100–$250 | $54,200 | $23,400 – $171,600 | 7.4% | 7.4% | 7.0% | $2,143 |
| $250 and up | $130,100 | $62,200 – $342,300 | 6.1% | 5.6% | 7.0% | $9,296 |
Retention is the mirror image of the churn columns. Your monthly customer retention rate is 100% minus your monthly user churn, so a company matching its cohort's user churn figure is also matching its cohort's customer retention. For what counts as a good retention rate, see what is a good customer retention rate.
Growth varies less across the cohorts than churn does. Four of the six cohorts show 7.0% revenue growth, while lifetime value climbs steeply with ARPU, from $107 under $10 to $9,296 at $250 and up. Open Benchmarks also shows a quick ratio for each cohort, pricing insights and a breakdown of failing cards and failure reasons.
Where can I find SaaS benchmarks for churn, growth and retention rates?
You can find free SaaS benchmarks for churn, growth and retention on Baremetrics Open Benchmarks, with no sign-up needed. To compare your own numbers against similar companies, use the Benchmarks feature inside Baremetrics, or the benchmark views that ChartMogul, ProfitWell Metrics and Stripe Billing build into their products.
- Baremetrics Open Benchmarks (free, public): MRR quartiles, user churn, revenue churn, revenue growth, lifetime value and quick ratio for six ARPU cohorts, plus pricing insights and failed-charge breakdowns. View Open Benchmarks.
- Baremetrics Benchmarks (in-app): places your own metrics against companies with a similar ARPU and explains the result in plain English. See Benchmarks and how to use Benchmarks.
- The State of Subscription Payment Recovery in 2026 (Baremetrics report): failed-payment recovery benchmarks from 119 typical US B2B SaaS companies using Recover in May 2026, including a median attempted recovery rate of 12.7%. Read the report.
- ChartMogul: its pricing page lists industry benchmarks on every plan, including Free, for comparing NRR, churn and growth with companies at a similar stage.
- ProfitWell Metrics by Paddle: a free metrics product that benchmarks your performance against other subscription and SaaS companies in its user base.
- Stripe Billing analytics: Stripe's documentation says you can benchmark your metrics against similar businesses on Stripe from the Billing dashboard.
Choose by the question you are asking. Public cohort data such as Open Benchmarks tells you what is normal for a company like yours. An in-product comparison tells you where your own company stands, which needs your billing data connected first.
What are SaaS financial benchmarks?
A benchmark is any value or measurement against which you can compare something's performance. When evaluating our businesses, it’s great to have benchmarks for how other businesses are doing so we can see if we’re performing higher or lower than the industry standard.
A SaaS financial benchmark refers to benchmarks that are specifically focused on average performance in the SaaS world. In particular, a SaaS financial benchmark is a benchmark about something financial, such as MRR, ARR or other financial metrics that are commonly used throughout the SaaS world.
Why use SaaS financial benchmarks?
At Baremetrics, we understand that SaaS companies need to consult SaaS financial benchmarks to discover, at a glance, what’s normal in the industry and what’s not. It’s the only way to stay competitive, successful, and relevant within any SaaS product niche.
SaaS financial benchmarks provide the sort of clarity that gives companies greater visibility and analysis of their metrics. Baremetrics provides SaaS financial benchmarks in two categories.
The first category, which you will readily find as Open Benchmarks, is only a tiny peek into the extensive financial benchmarks that Baremetrics has collected from over 800 businesses over the years. The full collection of benchmarks are accessible with a free trial for the Baremetrics Benchmarks feature in-app.
Open Benchmarks shows quick summaries for general cohort analysis, while a free trial can give you access to smart features that produce key metrics comparisons in accessible, plain language. With industry benchmarks, SaaS companies like yours can make effective decisions about strategic resource investments that result in solid revenue and soaring valuations.
What are the SaaS financial benchmarks that you can get with Baremetrics?
It’s impossible to know the industry average unless you have similar information from hundreds of companies. Fortunately, Baremetrics collects financial data from hundreds of companies, and we publish that data in an anonymized and accessible way.
Below is a shortlist of 10 actionable financial benchmarks that Baremetrics provides;
- Quick ratio: In SaaS, this metric compares the company’s new MRR with its MRR contraction rate.
- LTV: The customer lifetime value predicts the net profit a customer can contribute to a company over time.
- User Churn: For SaaS services, it is the percentage of subscribers who terminate their subscription within a time interval.
- Monthly Recurring Revenue: This is the metric of all recurring revenue normalized into a monthly amount. It’s a metric usually used among subscription and SaaS companies.
- Revenue Churn: This is a measure of loss of recurring revenue when subscribers cancel their subscriptions or downgrade.
- Revenue Growth: This measures the increase or decrease in a company’s sales over a period represented in percentage.
- Revenue by plan price: This is the revenue based on different plans and pricing.
- Free plans: This metric tracks the number of businesses that use free plans for their SaaS services.
- Pricing models: does it end with 0 or 9? This metric accounts for the benchmark pricing for different services and if it ends with 0 or 9.
- Number of plans: This accounts for the average number of plans that are being used at SaaS companies. For example, a company might have 5 different plans: trial, intro, medium, expert, and premium.

How does Baremetrics get this data?
Baremetrics is a unique product that has access to its customers' financial analyses. With each customer’s permission, Baremetrics collects, anonymizes, and publishes financial benchmarks using this data.
Typically, a SaaS company will undertake some internal cohort analysis to compute some of the metrics described earlier. However, the challenge is using your internal cohort analysis results for a cohort comparison, which yields actionable financial benchmarks that put your company’s internal cohort analysis results into perspective.
The metrics published on Open Benchmarks show, in explicit detail, how your SaaS company currently compares with other companies during cohort analysis.
Here’s a quick breakdown of SaaS financial benchmarks for companies with $25-$50 average revenue per user (ARPU):
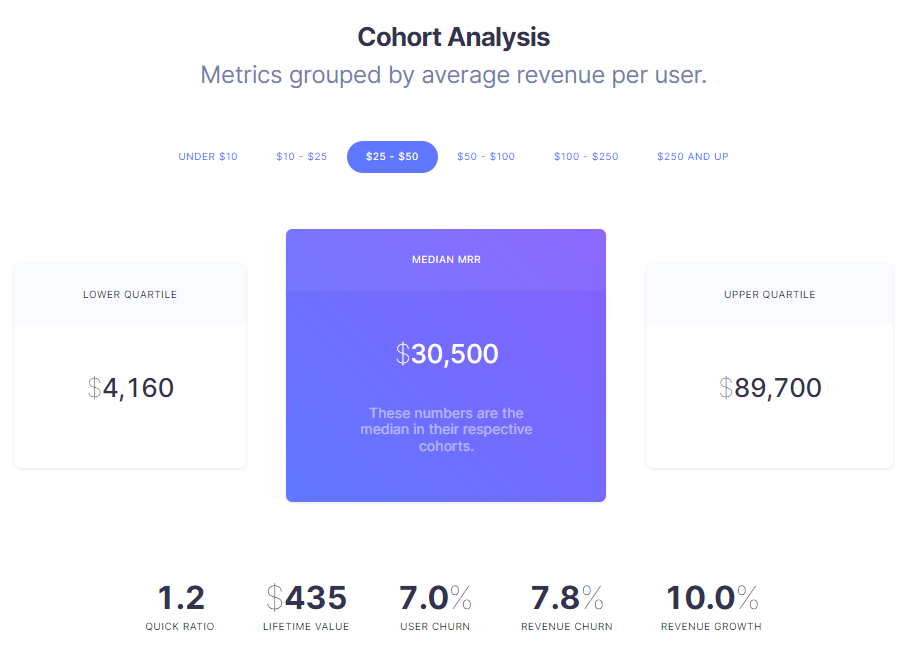
If your SaaS company happens to have a customer ARPU that falls within the $25-$50 range, you can already tell if your numbers are right or if they need some more work.
Take the LTV financial benchmark, for instance. It’s well-known that if your customer LTV exceeds the cost of customer acquisition (CAC), then that customer is profitable, and you can go ahead and acquire similar customers.
However, it isn’t always enough to know that your customer is profitable within this specific cohort value when LTV is compared with the CAC; that’s only an internal performance metric. It’s still a good idea to weigh your internal financial metrics with those of other companies. With this comparison, you can be sure that your company numbers and values are up to the industry standard in addition to just being profitable.
The paid Benchmarks and Smart Dashboards tools take a deeper dive into the insights that can be uncovered in your business’s finances. Together, these Baremetrics tools make your company’s financial analysis and growth easily trackable.
More Perks of SaaS Financial Benchmarks by Baremetrics
It isn’t news that your customers experience failed payments. As scandalous as this may sound, customers often want to keep paying for something but forget to because of something like a missed credit card transaction.
Incredibly, Companies lose up to 10% on failing payments monthly. To get that money out of your customer base, all you need to do is start prompting them when their credit card transactions don’t go through.
At Baremetrics, we’re constantly investigating why these failed payments occur. We even investigate the specific card types that fail and what benchmarks we can use to identify them.
Failed payments are a financial metric that is overlooked, but with the correct information about its frequency and how similar companies are moving to stop it, it can become a thing of the past.
The MRR line that doesn't show up in standard reporting
Beyond the metrics covered above, one number worth tracking separately is MRR at risk: the share of monthly recurring revenue currently tied to failed payments. Baremetrics data across hundreds of subscription businesses shows the average company loses around 9% of MRR to failed payments — typically the most recoverable revenue available. In the Baremetrics payment recovery benchmark, 119 typical US B2B SaaS companies using Recover in May 2026 collectively recovered more than $1.24 million in failed payments in a single month, at a median attempted recovery rate of 12.7%. The median company earned an 808% return on its Baremetrics subscription that month. For the methodology behind measuring this honestly, see our dunning recovery rate guide; for the full involuntary churn picture, see our complete guide to involuntary churn.

Knowing SaaS financial benchmarks gives you an edge
With the SaaS financial benchmarks provided by Baremetrics, you can know precise details about the following data;
- What is normal in my industry?
- What isn’t normal about my product?
- What do I prioritize?
- What metrics are the most important to look at?
Nothing gives a company an edge like knowing that their numbers are just right (or knowing what they must do to get them right). Everything else follows: goal-setting, pivots and iterations, agile development, and so much more.
From glances at the industry benchmarks to in-depth cohort comparisons, the Baremetrics Benchmark feature provides your company with the vital signs it needs to grow and succeed.
Look at more of what the Open Benchmarks say here, and start a free trial today!
Track this automatically
See your real churn rate — connect Stripe in one click
Skip the spreadsheet. Baremetrics calculates user churn, revenue churn, MRR, LTV and dozens of other subscription metrics straight from your billing data, and Benchmarks shows how they compare with similar companies.
Start your free trial → or explore the live demo
Screenshot shows sample demo data.
Frequently asked questions
What is a good monthly churn rate for a B2B SaaS company?
Baremetrics' guidance is 3–5% monthly customer churn for SaaS companies that sell to small businesses, and under 1% monthly for enterprise products. For context, the user churn figures on Baremetrics Open Benchmarks run from 5.8% to 8.4% a month across its six ARPU cohorts (October 14, 2026), so a company below 5% is beating every cohort. Early-stage companies often see 10–15% churn in their first year while they find product fit.
Where can I find SaaS benchmarks for churn, growth and retention rates?
Baremetrics Open Benchmarks publishes free, live benchmarks for user churn, revenue churn, revenue growth, MRR and lifetime value, split into six ARPU cohorts. To compare your own metrics against similar companies, use the Benchmarks feature inside Baremetrics. ChartMogul, ProfitWell Metrics and Stripe Billing analytics also build benchmark comparisons into their products, and Baremetrics publishes a separate benchmark report for failed-payment recovery.
What is the average monthly churn rate on Baremetrics Open Benchmarks?
Monthly user churn on Open Benchmarks ranges from 5.8% ($10–$25 ARPU) to 8.4% ($50–$100 ARPU), and monthly revenue churn ranges from 5.6% ($250 and up) to 8.8% ($50–$100). These are the figures the page displayed on October 14, 2026. User churn is the share of customers who cancelled in the last 30 days, while revenue churn is the share of MRR lost to cancellations and downgrades.
What revenue growth do SaaS companies on Open Benchmarks show?
Revenue growth on Open Benchmarks is 7.0% in four of the six ARPU cohorts, 5.0% for companies under $10 ARPU and 8.0% for the $25–$50 cohort. Growth varies far less across cohorts than lifetime value does, which climbs from $107 under $10 ARPU to $9,296 at $250 and up.
What is the difference between user churn and revenue churn?
User churn measures the share of customers who cancel, while revenue churn measures the share of recurring revenue lost when customers cancel or downgrade. The two can diverge. On Open Benchmarks, the $250-and-up cohort shows 6.1% user churn but 5.6% revenue churn, while every other cohort loses revenue at the same rate as customers or faster. Track both, because a company can keep its customers and still lose revenue to downgrades.
How does Baremetrics build its SaaS benchmarks?
With each customer's permission, Baremetrics collects, anonymizes and aggregates its customers' subscription data, then groups companies by average revenue per user. Open Benchmarks shows the public summary of that data set. The Benchmarks feature inside Baremetrics uses the same data to show where your own company stands against companies with a similar ARPU.

