Table of Contents

Customer segmentation is the practice of grouping subscribers by shared attributes, such as plan type, MRR range, tenure, acquisition source, so you can analyze which customer segments drive revenue, which churn fastest, and where to focus your efforts.
The best customer segmentation tools for SaaS in 2026 go beyond basic demographic filters. They offer real-time dynamic segments that update automatically as customer data changes, integrate directly with subscription billing platforms like Stripe and Chargebee, and let you break down key metrics like MRR, churn rate, and lifetime value by segment.
In this guide, we compare the top customer segmentation tools for SaaS companies, covering features, pricing, and what each tool does best, so you can find the right fit for your subscription business.
Best Customer Segmentation Tools for SaaS: The Roundup
1. Baremetrics

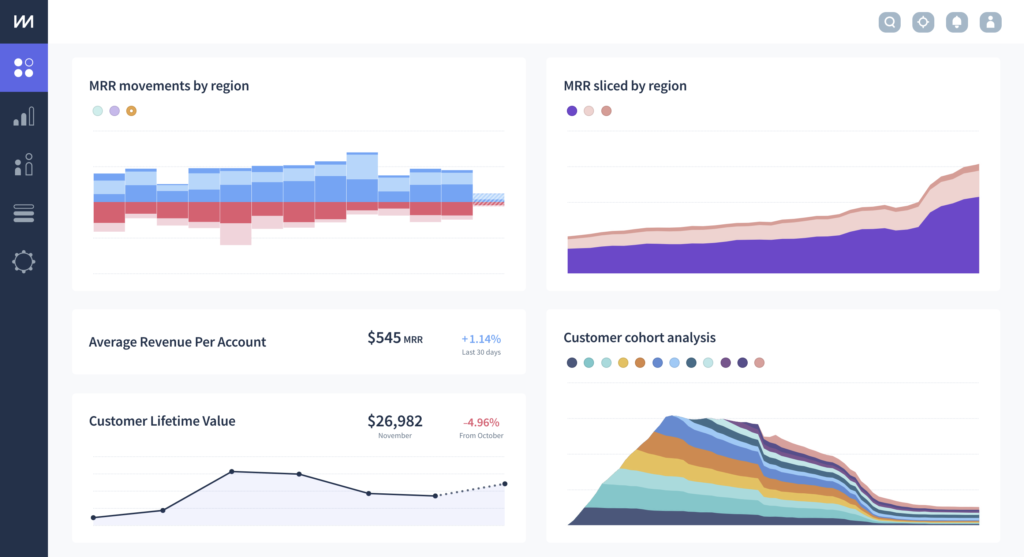
MRR Movements in Baremetrics
Best for: SaaS and subscription businesses that need to segment customers by revenue metrics (such as MRR, churn, LTV, plan type) and see real-time performance by segment.
Baremetrics is a subscription analytics platform built specifically for recurring revenue businesses. Unlike general-purpose analytics tools, Baremetrics connects directly to your billing provider and automatically calculates SaaS metrics, then lets you slice those metrics by customer segment.
Key segmentation features:
-
Revenue-based segmentation: Group customers by MRR bracket, LTV range, or ARR tier to compare how different revenue segments perform over time.
-
Plan and pricing tier segmentation: Consolidate messy pricing structures by grouping related plans together. This is useful if your Stripe account has dozens of legacy price IDs.
-
Custom attribute segmentation: Filter by metadata fields you pass through your billing integration, such as assigned sales rep, account manager, UTM source, or acquisition campaign.
-
Signup date and tenure segmentation: Compare customers acquired before and after product or pricing changes to measure impact on retention and expansion.
-
Geographic segmentation: Break down metrics by country or region to understand performance across markets.
-
Real-time segment updates: Segments update automatically as subscription data syncs: no manual refreshes or stale reports.
What sets Baremetrics apart:
-
Revenue-first segmentation: Ties segments directly to MRR, churn, and LTV — not just engagement metrics. Answer questions like: Which customer segments have the highest churn? Which plan tiers drive the most expansion MRR?
-
Churn prevention tools: Recover reduces failed payment churn with an ROI guarantee. Cancellation Insights captures why customers leave so you can segment by churn risk and take action.
-
Investor-ready reporting: Investor Links let you share read-only dashboards with stakeholders without giving full account access.
-
Multi-provider support: Combine Stripe, App Store, Chargebee, and other billing sources into one unified view to segment your entire subscriber base.
Integrations: Stripe, Chargebee, Recurly, Braintree, Apple App Store, Google Play, Shopify, QuickBooks, Xero, plus a custom API for any billing setup.
Pricing: Free for startups up to $10K MRR through the Accelerator plan. From $10K MRR, pricing starts at $49/month. Paid plans for larger businesses start at $108/month. 14-day free trial available on all plans.
Pros:
-
Purpose-built for subscription and SaaS businesses
-
Free for early-stage startups (up to $10K MRR)
-
Segments tie directly to MRR, churn, LTV, and other revenue metrics
-
Connects to multiple billing providers in one dashboard
-
No SQL or engineering resources required
Cons:
-
Focused on subscription metrics: not a general product analytics or behavioral tracking tool
-
Less suited for eCommerce or non-subscription business models
2. ChartMogul
MRR Dashboard in ChartMogul
Best for: SaaS companies that need subscription analytics across multiple billing sources, with strong cohort analysis and benchmarking capabilities.
ChartMogul is a subscription analytics platform that imports billing data from multiple sources and provides revenue reporting, cohort analysis, and customer segmentation for recurring revenue businesses.
Key segmentation features:
-
Multi-source data unification: Connect billing data from Stripe, Chargebee, Recurly, Braintree, and other platforms into a single dashboard.
-
Flexible segmentation filters: Segment customers by plan, country, lead source, or custom attributes to compare MRR, churn, LTV, and ARPA across groups.
-
Cohort analysis: Track how different customer cohorts retain and expand over time based on signup period.
-
Data enrichment: Automatically enrich customer profiles with metadata like company size and industry using integrations with Clearbit and other providers.
-
SaaS benchmarks: Compare your segmented metrics against benchmarks from thousands of other SaaS companies.
What sets ChartMogul apart:
ChartMogul is strong on data visualization and cohort reporting. If you need to present investor-ready dashboards or compare performance across billing systems, it handles multi-source data well. The built-in benchmarks are useful for understanding how your segments stack up against industry averages.
Integrations: Stripe, Chargebee, Recurly, Braintree, Paddle, PayPal, HubSpot, Intercom, Segment, Salesforce, BigQuery, Snowflake, and more.
Pricing: Free for companies under $10K MRR. Paid plans start at $99/month for the Pro tier. Enterprise pricing available.
Pros:
-
Free tier for early-stage startups
-
Strong cohort analysis and visualization
-
Connects to multiple billing platform
-
Built-in SaaS benchmarks
Cons:
-
Segmentation is less flexible than some competitors for custom attributes
-
No built-in tools for payment recovery or cancellation insights
-
Some users report a learning curve for advanced reporting
3. ProfitWell Metrics (by Paddle)
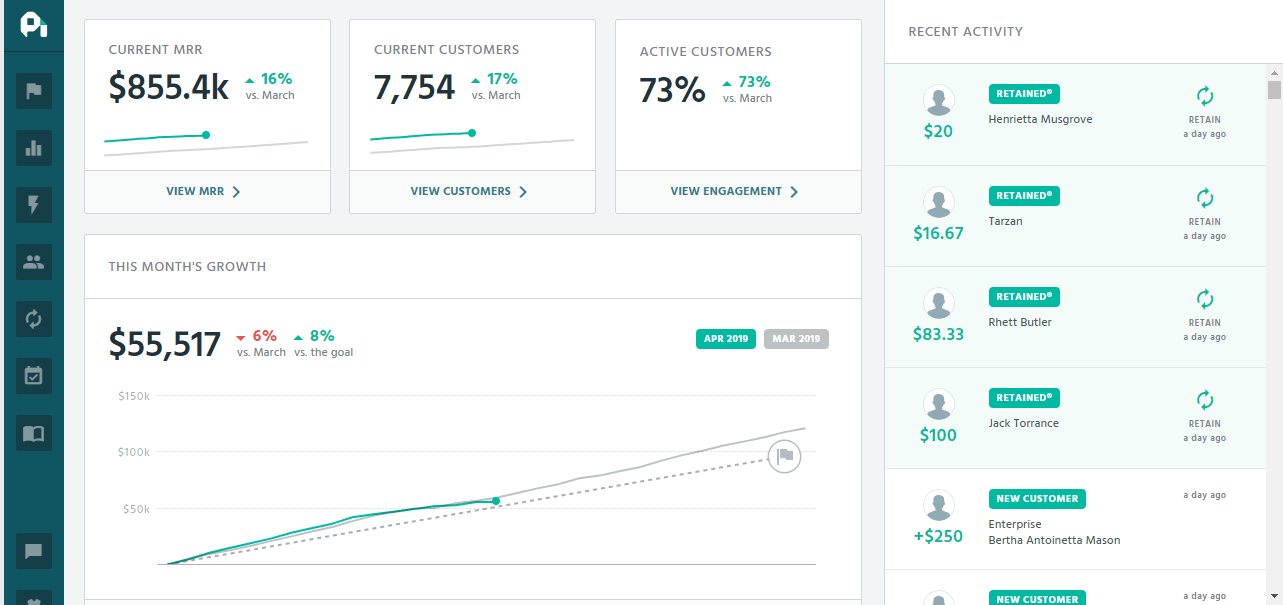
MRR Dashboard in ProfitWell
Best for: SaaS companies looking for free subscription analytics with basic segmentation, cohort reporting, and industry benchmarking.
ProfitWell Metrics is a free subscription analytics tool (now part of Paddle) that provides core SaaS metrics, segmentation, and benchmarking. It connects to your billing system and calculates MRR, churn, LTV, and other metrics automatically.
Key segmentation features:
-
Plan comparison: Compare up to five pricing plans based on MRR, churn rate, and LTV to understand which plans perform best.
-
Cohort analysis: Track customer cohorts over time to identify retention patterns.
-
Custom trait segmentation: Upload custom traits like account owner or campaign source to create segments and discover which customers deliver the most value.
-
Country segmentation: Segment revenue by geography to understand regional performance (available for Paddle Billing users).
-
Data enrichment: Profiles are automatically enriched with Clearbit and FullContact data for deeper segmentation.
-
Benchmarking: Compare your metrics against 30,000+ subscription companies.
What sets ProfitWell apart:
The core product is completely free, which makes it an accessible starting point for early-stage SaaS companies. The benchmarking feature is particularly useful for understanding how your segmented metrics compare to similar companies.
Integrations: Stripe, Chargebee, Recurly, Braintree, Zuora, Paddle, HubSpot, Intercom, Salesforce, and Slack.
Pricing: Free for core subscription metrics. Premium add-ons (Retain for churn reduction, Recognized for revenue recognition) available at additional cost.
Pros:
-
Free core product with no usage limits
-
Automatic data enrichment included
-
Strong benchmarking against 30K+ companies
-
Easy setup with most billing platforms
Cons:
-
Now part of Paddle, which may affect long-term product direction for non-Paddle users
-
Segmentation is less flexible than purpose-built tools
-
Some users report slower data refresh times
-
UI hasn't been updated significantly in recent years
4. Mixpanel
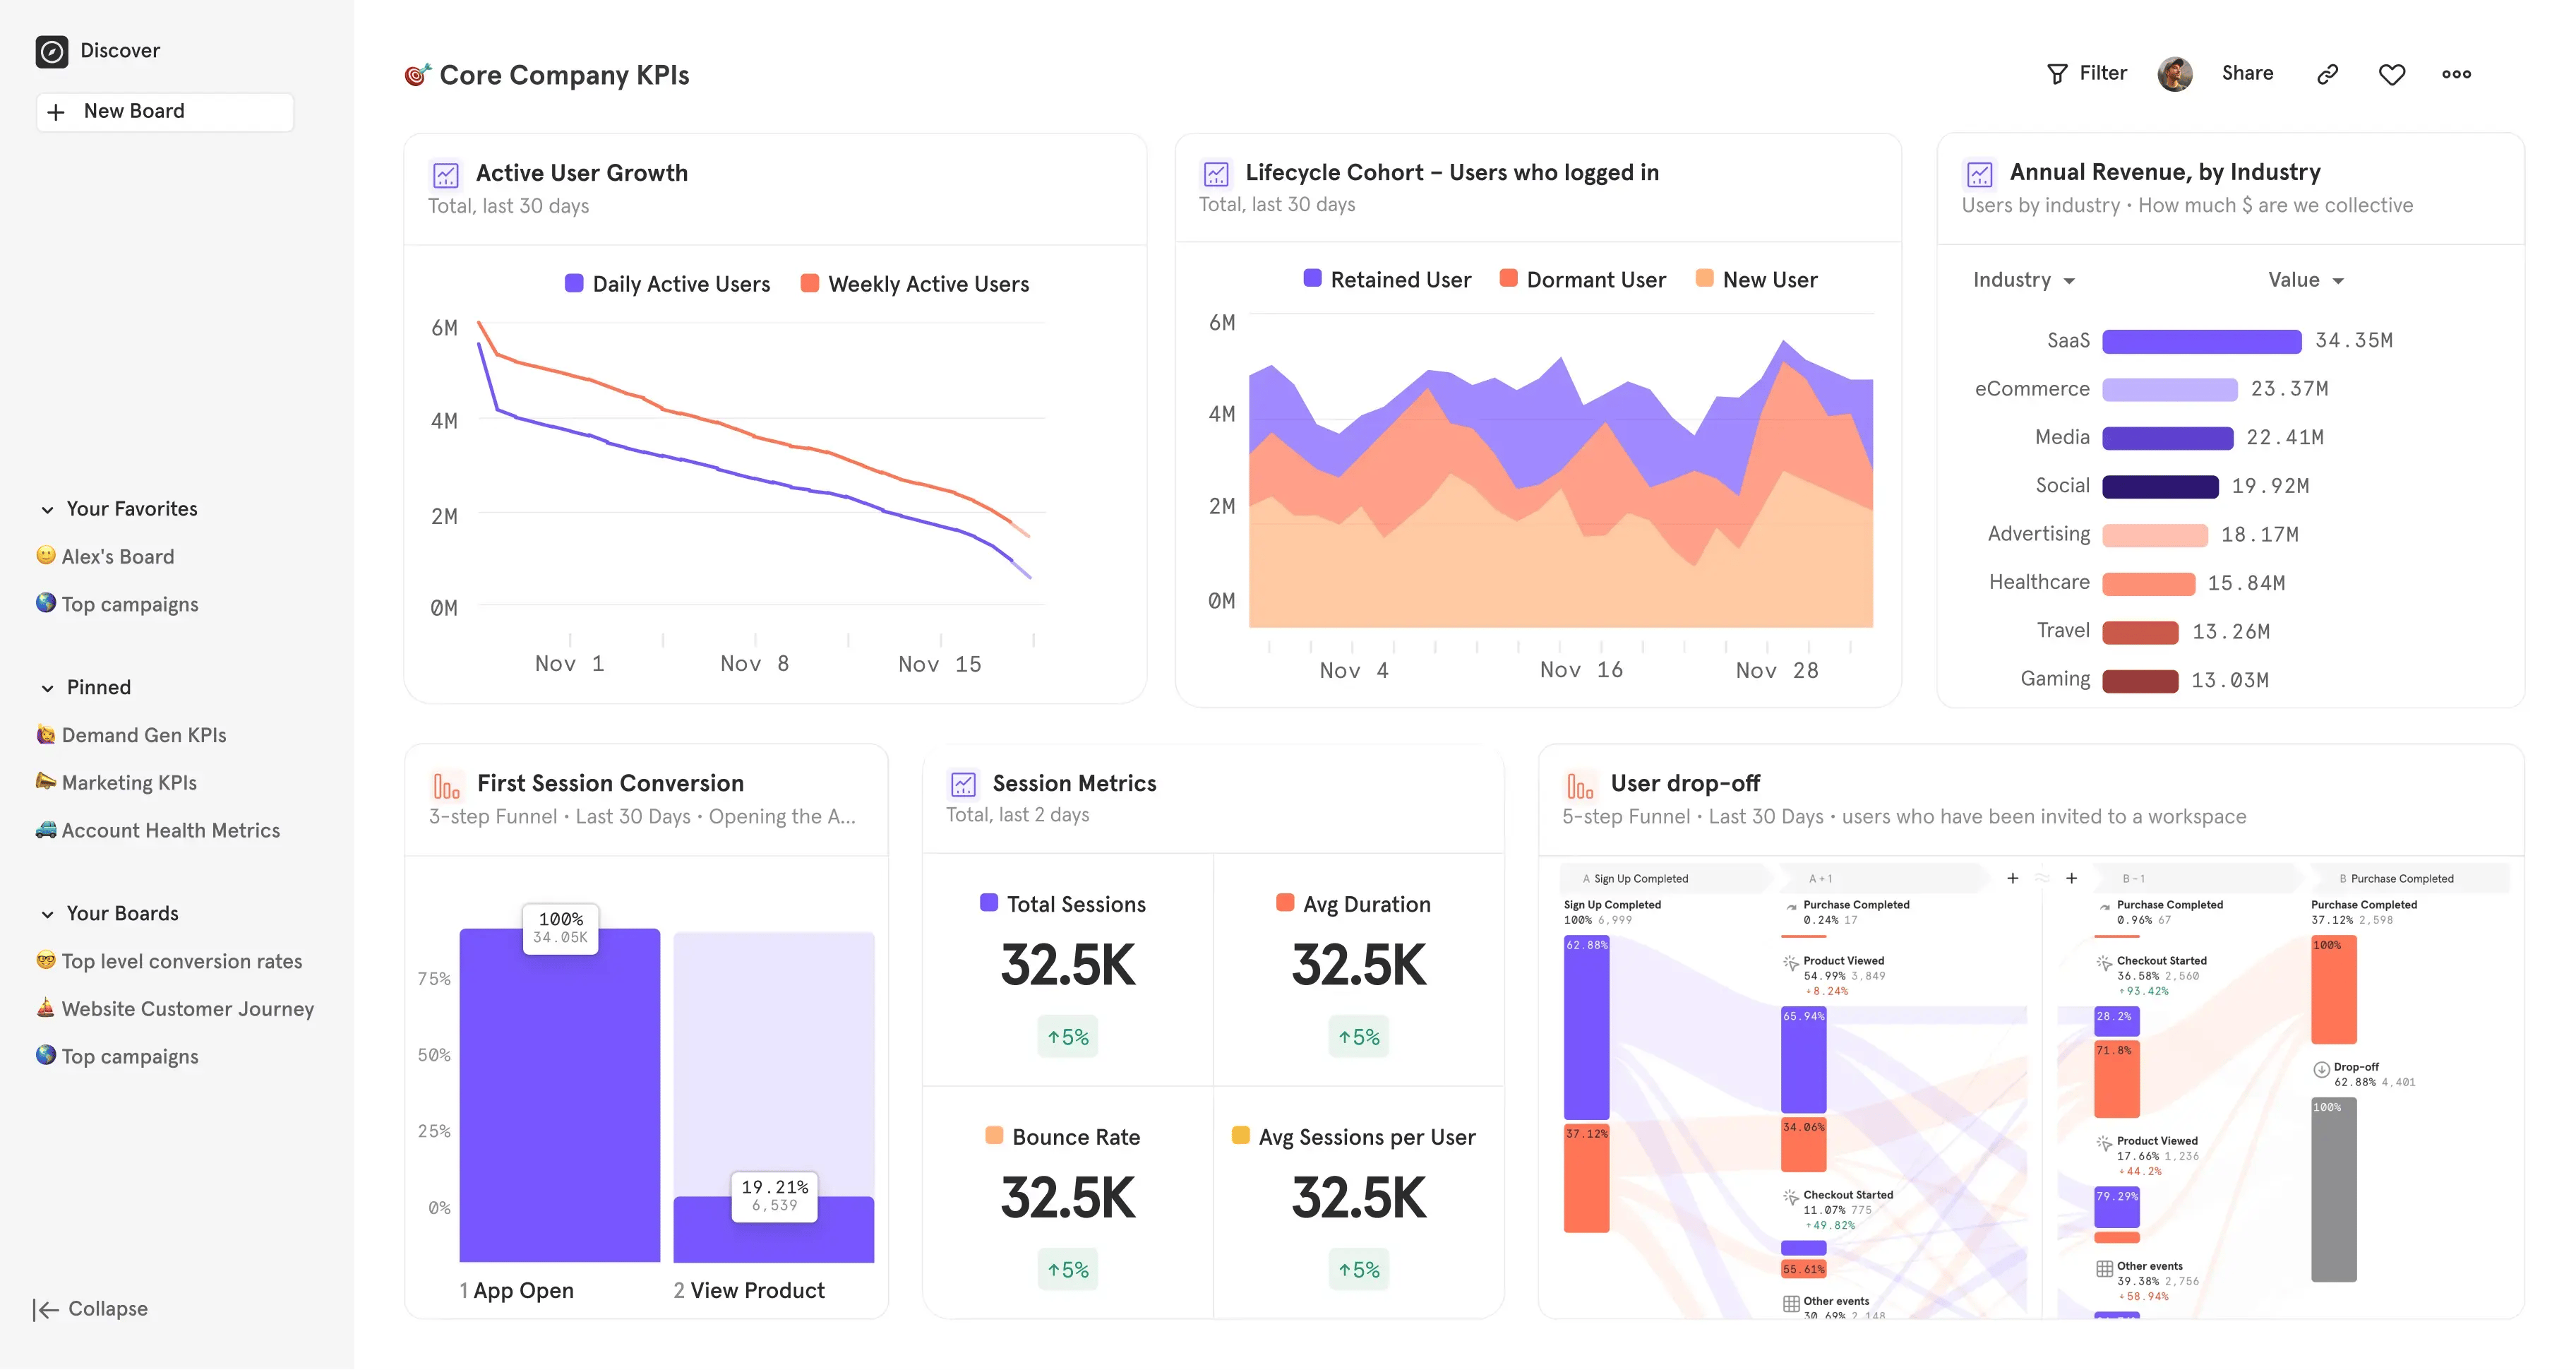
KPI Dashboard in Mixpanel
Best for: Product and growth teams that need to segment users by in-app behavior, events, and engagement patterns, not just billing data.
Mixpanel is a product analytics platform that tracks user behavior within your application. It's designed to help teams understand how users interact with features, where they drop off in funnels, and how engagement patterns differ across segments.
Key segmentation features:
-
Behavioral segmentation: Group users based on actions they take (or don't take) within your product — like feature usage, onboarding completion, or engagement frequency.
-
Event-based filtering: Segment by any event you track, then analyze conversion, retention, or engagement for that group.
-
Cohort analysis: Build cohorts based on behavior (e.g., "users who completed onboarding in the first 7 days") and track how they perform over time.
-
User properties: Segment by attributes like plan type, company size, or custom properties you pass through the SDK.
-
Funnel analysis: See how different segments convert through key flows in your product.
-
Real-time segmentation: Segments update as new event data comes in.
What sets Mixpanel apart:
Mixpanel excels at behavioral analytics, essentially understanding what users do inside your product, not just what they pay. This makes it a strong complement to subscription analytics tools if you need to connect product engagement to retention outcomes.
Integrations: Segment, mParticle, Snowflake, BigQuery, HubSpot, Salesforce, Braze, and hundreds of other tools via CDPs and direct integrations.
Pricing: Free plan includes up to 1M events/month. Paid Growth plan starts around $100 for 1.5M events/month and scales with event volume. Enterprise pricing available.
Pros:
-
Deep behavioral and event-based segmentation
-
Generous free tier for startups
-
Strong funnel and retention analysis
-
Real-time data
Cons:
-
No native subscription or revenue metrics — you'll need a separate tool for MRR, churn, LTV
-
Event-based pricing can get expensive as you scale
-
Requires engineering effort to implement tracking properly
-
Steeper learning curve for non-technical teams
5. Amplitude
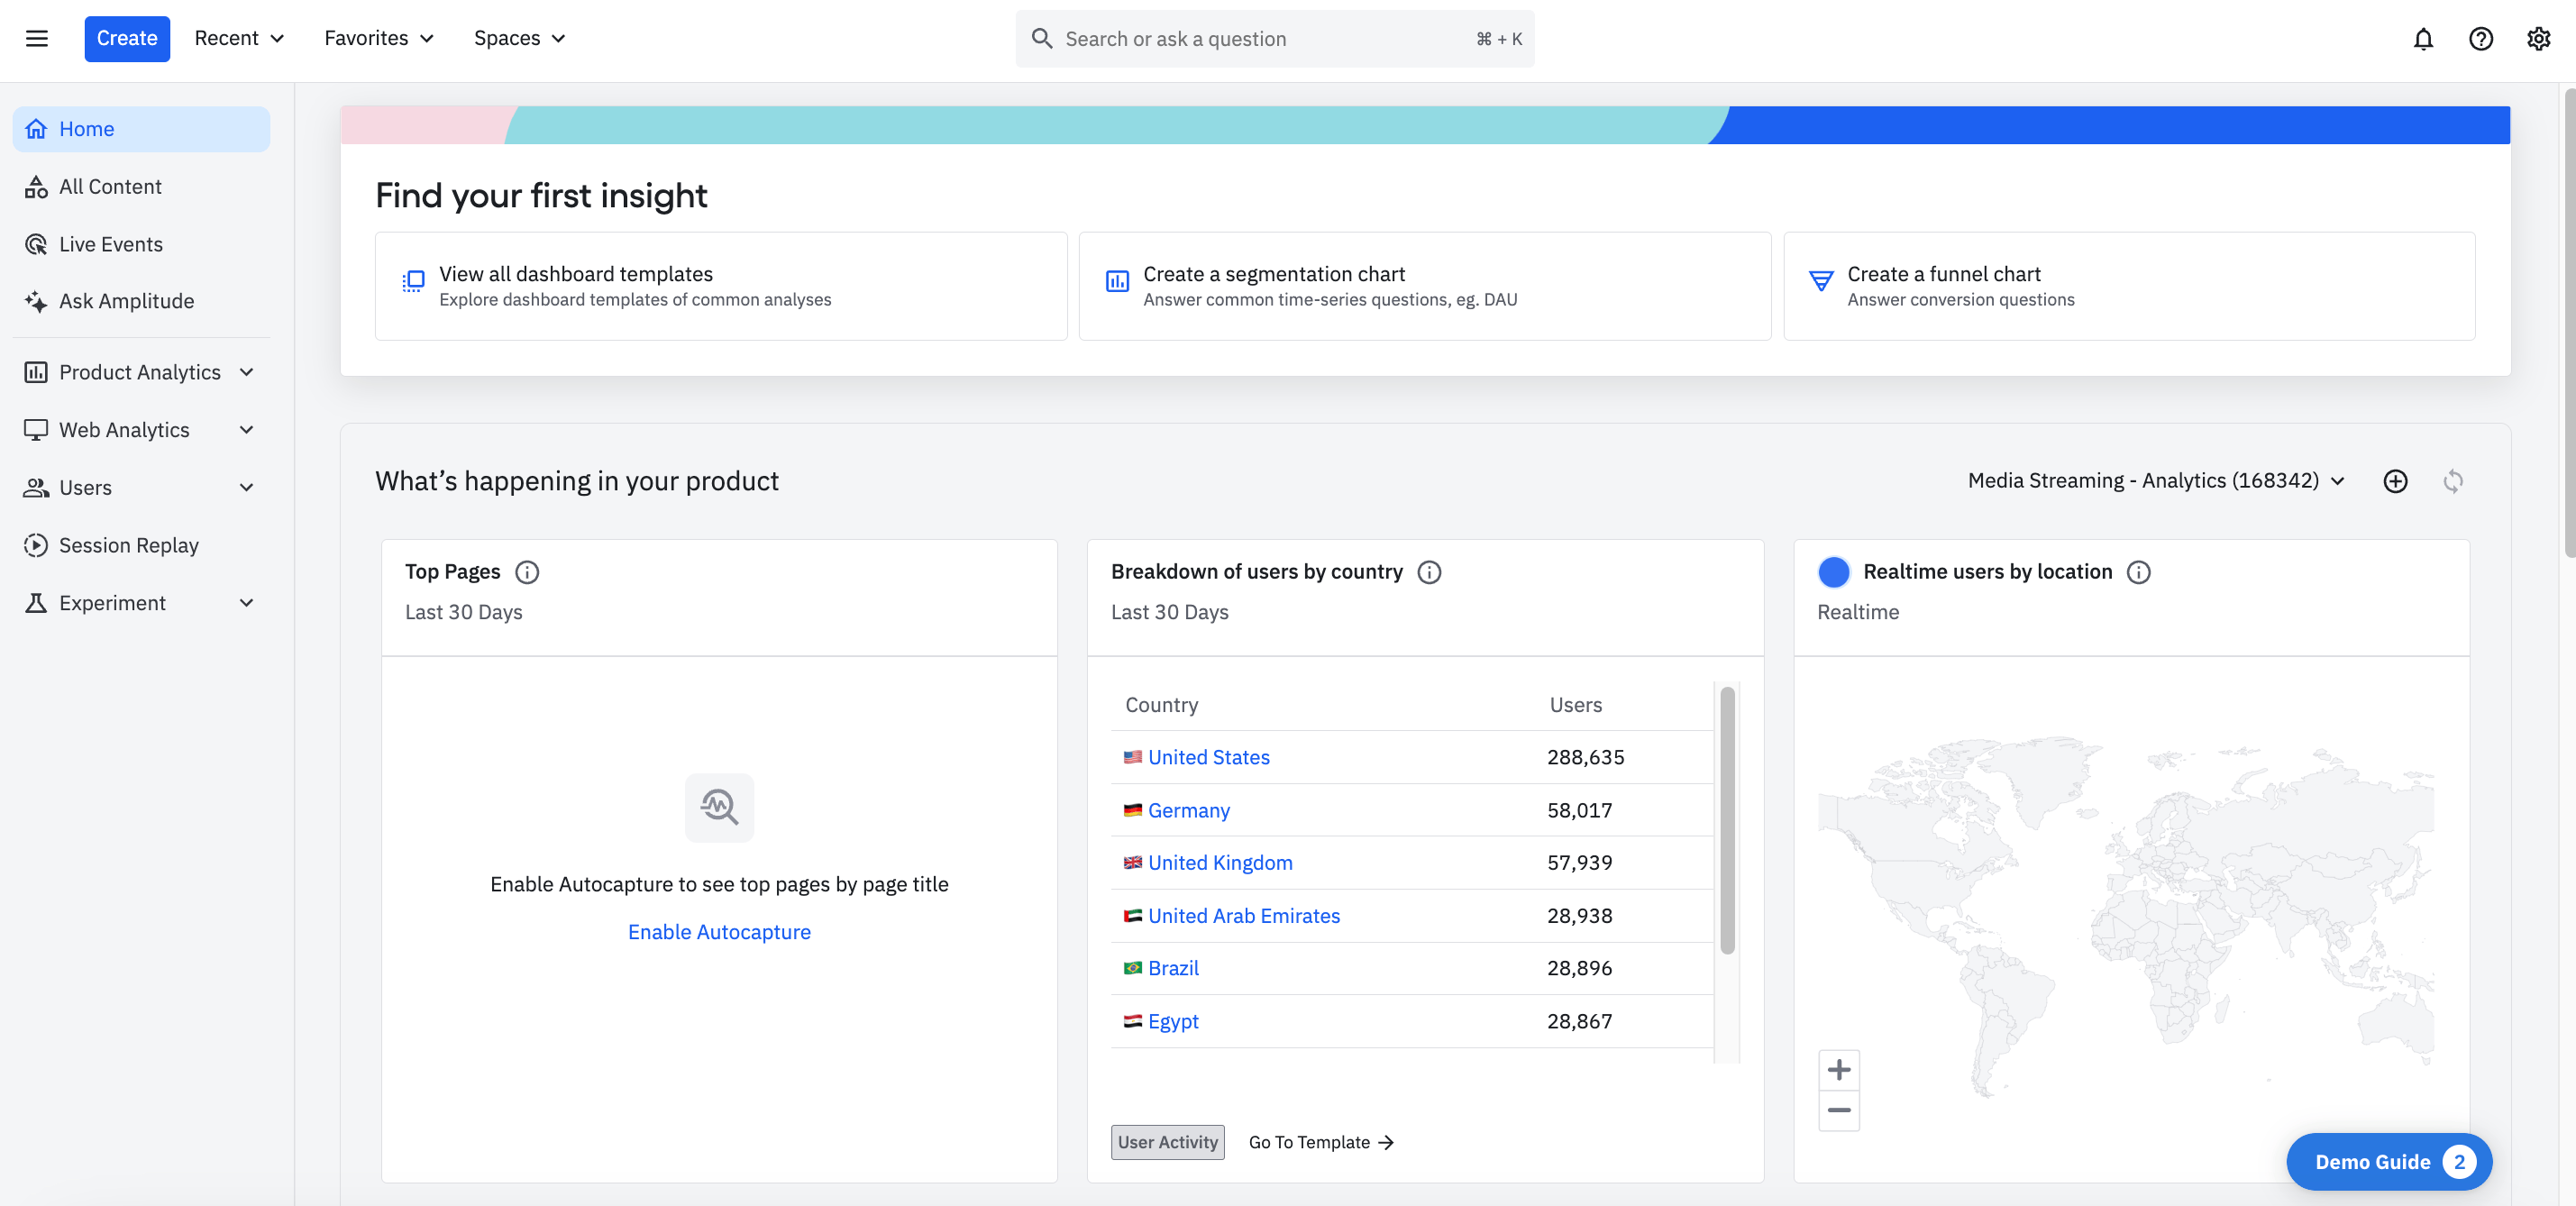
Dashboard set-up in Amplitude
Best for: Product-led growth teams that need advanced behavioral analytics, predictive cohorts, and experimentation capabilities tied to user segmentation.
Amplitude is a digital analytics platform focused on understanding user behavior across web and mobile products. It offers deep segmentation, cohort analysis, and predictive tools to help teams identify which behaviors drive retention and growth.
Key segmentation features:
-
Behavioral cohorts: Segment users based on sequences of actions, feature adoption, or engagement patterns over time.
-
Predictive cohorts: Use machine learning to identify users likely to convert, churn, or hit other outcomes.
-
User and event properties: Filter by any attribute or event to create dynamic segments.
-
Journey analysis: Visualize how different segments move through your product and where they drop off.
-
A/B test segmentation: Analyze experiment results by segment to understand which user types respond to changes.
-
Cross-platform tracking: Segment users across web, iOS, and Android in a single view.
What sets Amplitude apart:
Amplitude is built for product-led growth companies that need to understand the why behind user behavior. Its predictive features and experiment analysis make it particularly strong for teams running frequent product tests and optimizing activation flows.
Integrations: Segment, Snowflake, BigQuery, Braze, HubSpot, Salesforce, and 100+ other tools.
Pricing: Free Starter plan includes up to 50K monthly tracked users. Plus plan starts at $49/month. Growth and Enterprise plans use custom pricing (typically $20K–$100K+/year for mid-market).
Pros:
-
Advanced behavioral and predictive segmentation
-
Strong cohort and retention analysis
-
Built-in experimentation tools
-
Generous free tier for early-stage teams
Cons:
- No native subscription revenue metrics
- Pricing scales quickly with usage — can get expensive at scale
- Complex feature set requires onboarding time
- Enterprise features gated behind higher tiers
6. HubSpot
HubSpot's Dashboard
Best for: Marketing and sales teams that need CRM-based segmentation tied to lifecycle stage, lead scoring, and campaign engagement, with subscription data pulled in via integrations.
HubSpot is a CRM and marketing automation platform that offers contact segmentation (recently rebranded as "Segments") based on demographics, behaviors, lifecycle stage, and engagement with marketing campaigns.
Key segmentation features:
-
List and segment building: Create static or dynamic lists based on contact properties, form submissions, email engagement, page views, and CRM data.
-
Lifecycle stage segmentation: Group contacts by where they are in your Sales funnel: contact, lead, MQL, SQL, or customer.
-
Lead scoring: Automatically score and segment leads based on engagement and fit criteria.
-
Behavioral triggers: Segment by actions like "visited pricing page" or "downloaded whitepaper" to trigger targeted campaigns.
-
AI-powered segment suggestions: HubSpot's Breeze AI recommends new segments based on your CRM data and goals.
-
Cross-object segmentation: Segment by company, contact, or deal properties for B2B use cases.
What sets HubSpot apart:
HubSpot's strength is tying segmentation directly to marketing and sales workflows. If your goal is to segment for email campaigns, lead nurturing, or sales outreach, rather than subscription revenue analysis, HubSpot handles that well within its ecosystem.
Integrations: Native CRM; integrates with Stripe, QuickBooks, Salesforce, Slack, and 1,000+ apps via the HubSpot App Marketplace.
Pricing: Free CRM includes basic list segmentation. Marketing Hub Starter starts at $20/month. Professional starts at $890/month with advanced automation and segmentation features.
Pros:
-
Unified CRM, marketing, and sales platform
-
Strong for lifecycle and engagement-based segmentation
-
AI-powered segment recommendations
-
Large integration ecosystem
Cons:
-
Not designed for subscription revenue segmentation; there's no native MRR, churn, or LTV metrics without using an additional integration of another tool
-
Advanced segmentation features require expensive Professional tier
-
Can become complex and costly as you add Hubs and contacts
-
Requires third-party integrations to connect billing data
How to Choose the Right Tool
The best customer segmentation tool for your SaaS depends on what you're trying to segment for:
| If you need to... | Consider... |
| Break down MRR, churn, and LTV by customer segment | Baremetrics, ChartMogul, ProfitWell |
| Understand product behavior and feature adoption | Mixpanel, Amplitude |
| Segment for email, ads, and marketing campaigns | HubSpot |
| Get started free with basic subscription metrics | Baremetrics (under $10K MRR), ProfitWell, ChartMogul (under $10K MRR) |

