Table of Contents

Customer segmentation metrics are the specific data points you use to divide your subscriber base into meaningful groups, so you can track performance, identify patterns, and take action at the segment level rather than in aggregate.
For SaaS businesses, the most important segmentation metrics go beyond basic demographics. Tracking customers by cohort, churn rate, customer lifetime value (LTV), and monthly recurring revenue (MRR) gives you a granular view of which customer groups are growing, which are at risk, and where your revenue is actually coming from.
We'll cover the four segmentation metrics that matter most for subscription businesses and how to use each one to make smarter decisions about retention, marketing, and growth.
"Every customer is the same."
It’s that kind of thinking that’s tanked many businesses over the years.
Think about it—do you know your customers’ preferences? Buying habits? Transaction history?
What about purchasing behavior or favorite online channels?
Customer segmentation is a must—because all customers are not the same. The Baremetrics customer segmentation tool helps you divide your customers by any metric you choose.
But what are the top customer segmentation metrics?
Want to see what Baremetrics can do for your business? Consider a free 14-day trial.
What are Customer Segmentation Metrics?
Customer segmentation metrics are the measurable attributes you use to group customers into distinct segments. Common segmentation dimensions include demographics (company size, industry, geography), behavioral data (feature usage, login frequency, engagement), and subscription data (plan type, billing interval, MRR bracket, signup date).
For subscription businesses, the most actionable segmentation metrics are the ones tied directly to revenue and retention because they let you answer questions like:
-
Which customer groups churn the most?
-
Which segments have the highest lifetime value?
-
Are customers who signed up last quarter retaining better than those from a year ago?
The metrics below are the four most important for SaaS companies to track.
Want to learn more about your subscription customers? Baremetrics offers the above data and more! Consider a free 14-day trial.
What’s the Impact of Customer Segmentation Metrics?
When you track the right segmentation metrics, you stop making decisions based on averages and start making decisions based on the specific behavior of specific customer groups.
That distinction matters enormously in subscription businesses, where a single aggregate metric (like an overall churn rate of 3%) can mask the fact that one customer segment is churning at 8% while another is nearly flat.
Segmentation metrics give you the resolution to spot those differences. They inform which customers to prioritize for retention outreach, which segments to focus upsell campaigns on, and which acquisition channels are actually bringing in durable, high-value subscribers.
The four metrics that we'll explore in the next section are where that analysis starts.
4 Customer Segmentation Metrics You Should Be Tracking—And Why
The above metrics impact your business, your churn rate, and, ultimately, your bottom line, but let’s dive into these customer segmentation metrics you should be tracking and why they’re most important.
1) Cohort segmentation
Cohort segmentation groups customers by a shared starting point (most commonly their signup date or first subscription date) and tracks how that group behaves over time. Instead of looking at all your customers as a single pool, cohort analysis lets you compare how different groups of subscribers retain, expand, and churn month after month.
For SaaS businesses, cohort segmentation is one of the most powerful tools available. It answers questions that no other metric can:
-
Are customers who signed up after your onboarding redesign retaining better than those who signed up before?
-
Do customers acquired through a specific channel churn faster in their first 90 days?
-
Is your overall retention improving or declining across recent cohorts?
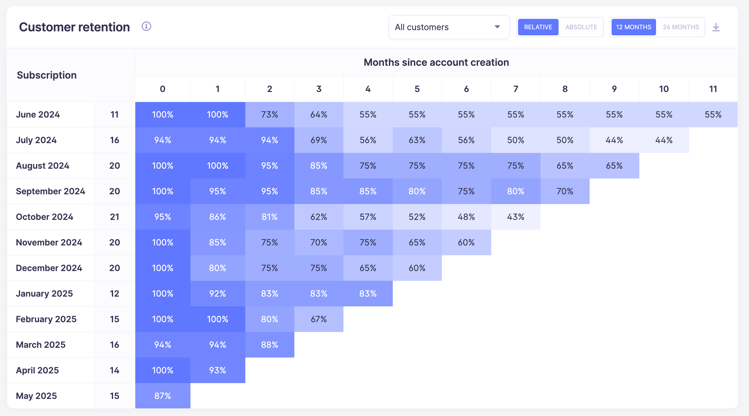
An example of a cohort retention chart in Baremetrics
A cohort retention chart, which shows what percentage of each signup group is still active at 1, 3, 6, and 12 months, is the clearest way to visualize this. A healthy SaaS business typically shows a "flattening" curve: customers who make it past the first 60-90 days tend to stick around. If your retention curves keep declining without leveling off, it signals a product fit or engagement problem worth investigating at the segment level.
In Baremetrics, you can run cohort retention reports filtered by plan type, MRR bracket, or acquisition source, so you're not just seeing how cohorts perform overall, but also how specific types of customers within each cohort behave over time.
2) User churn segmentation
Churn rate is one of the most important metrics for any subscription business, but tracking churn in aggregate only tells you part of the story. User churn segmentation means breaking down your churn rate by customer group, such as by plan type, tenure, billing interval, company size, acquisition channel, or any other attribute, to understand which segments are driving your overall churn number.
This matters because churn is rarely uniform across a customer base. Monthly subscribers often churn at a much higher rate than annual subscribers. Customers in their first 30 days churn at a higher rate than customers who've been active for six months.
Enterprise customers may churn less frequently but represent larger revenue loss when they do. Segmenting churn by these dimensions lets you move from reactive to proactive: instead of trying to win back customers who've already cancelled, you can identify the behavioral or demographic signals that predict churn and intervene earlier.
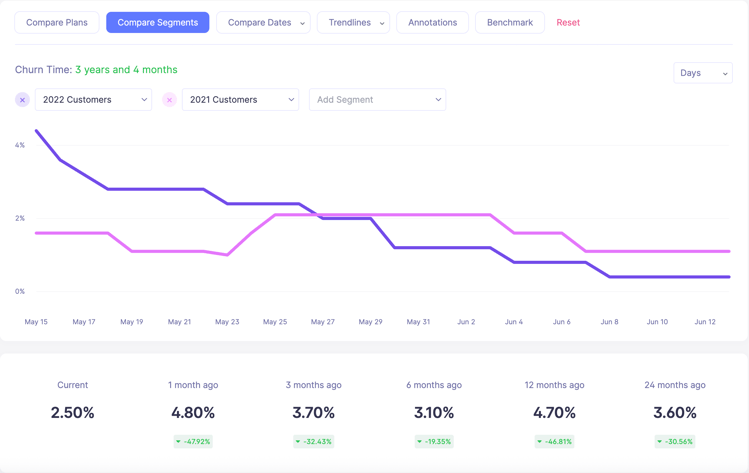
Segmenting user churn rate in Baremetrics
In Baremetrics, you can filter both customer churn rate and revenue churn rate by any segment you create, which gives you a clear picture of which subscriber groups are at highest risk and where retention efforts will have the most impact.
3) Customer lifetime value (LTV) segmentation
Customer lifetime value (LTV) estimates the total revenue a customer is expected to generate over the course of their relationship with your business. Segmenting customers by LTV, rather than tracking a single average LTV for your entire customer base, reveals which types of customers are actually your most valuable, and which segments may be costing more to acquire and support than they return in revenue.
LTV segmentation is especially useful for aligning marketing and sales strategy. When you know that customers from a specific industry, pricing tier, or acquisition channel have a significantly higher LTV than others, you can focus acquisition budget on the channels and profiles most likely to bring in durable, high-value subscribers. You can also use LTV segmentation to personalize retention and upsell strategies: high-LTV customers may warrant dedicated account management or early access to new features, while lower-LTV segments may respond better to automated campaigns or pricing incentives.
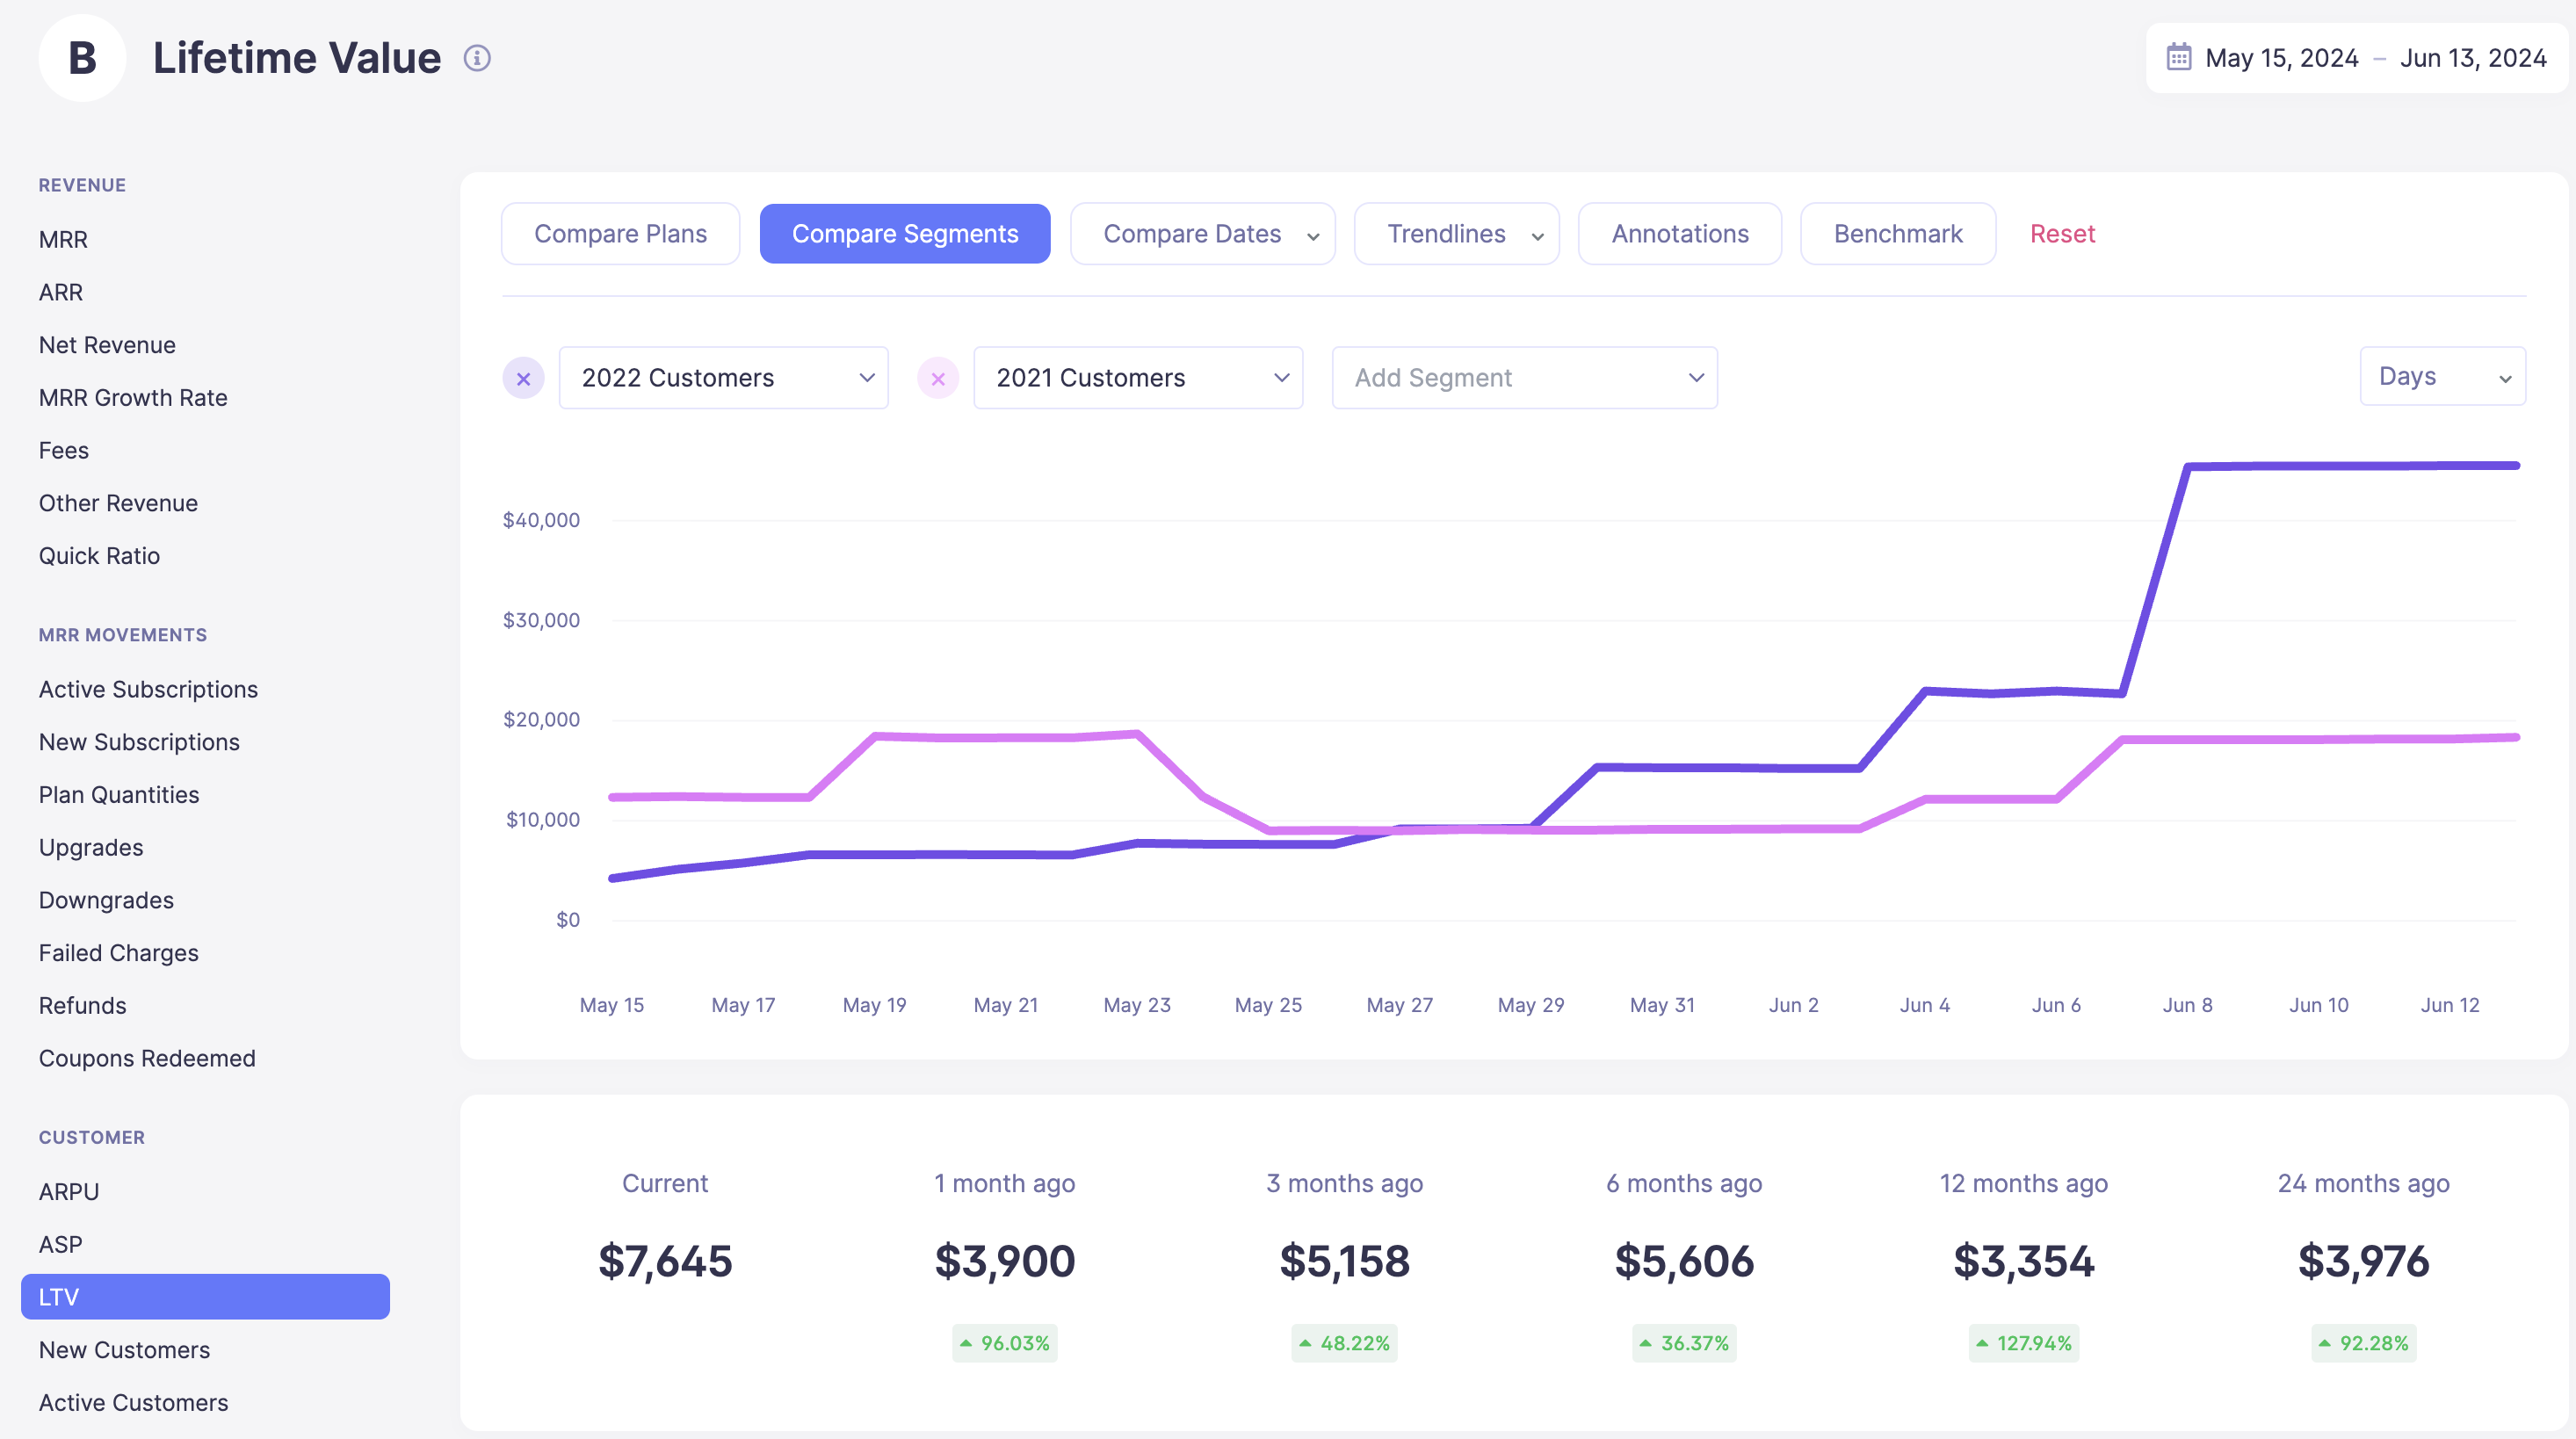
Segmenting lifetime value (LTV) in Baremetrics
Because LTV is a function of both average revenue per customer and retention, it naturally connects to the other segmentation metrics on this list, especially churn and MRR. Improving retention in a low-LTV segment has a compounding effect on that segment's lifetime value over time.
4) Monthly recurring revenue (MRR) segmentation
MRR is the foundation of subscription business analytics, as it tells you exactly how much predictable revenue your business generates each month. But like churn, MRR tracked only in aggregate can obscure important dynamics happening at the segment level. MRR segmentation means breaking down your recurring revenue by customer group to understand where your revenue is concentrated, which segments are growing, and where contraction is happening.
Common ways to segment MRR include:
-
plan type [Which pricing tier generates the most revenue?]
-
billing interval [How does annual vs. monthly MRR compare?]
-
customer tenure [Are newer customers contributing as much MRR as long-term subscribers?]
-
acquisition channel [Which sources are bringing in the highest-value subscribers?]
You can also track expansion MRR, which is revenue from upgrades and add-ons, by segment to identify which customer groups are most likely to grow their spend over time.
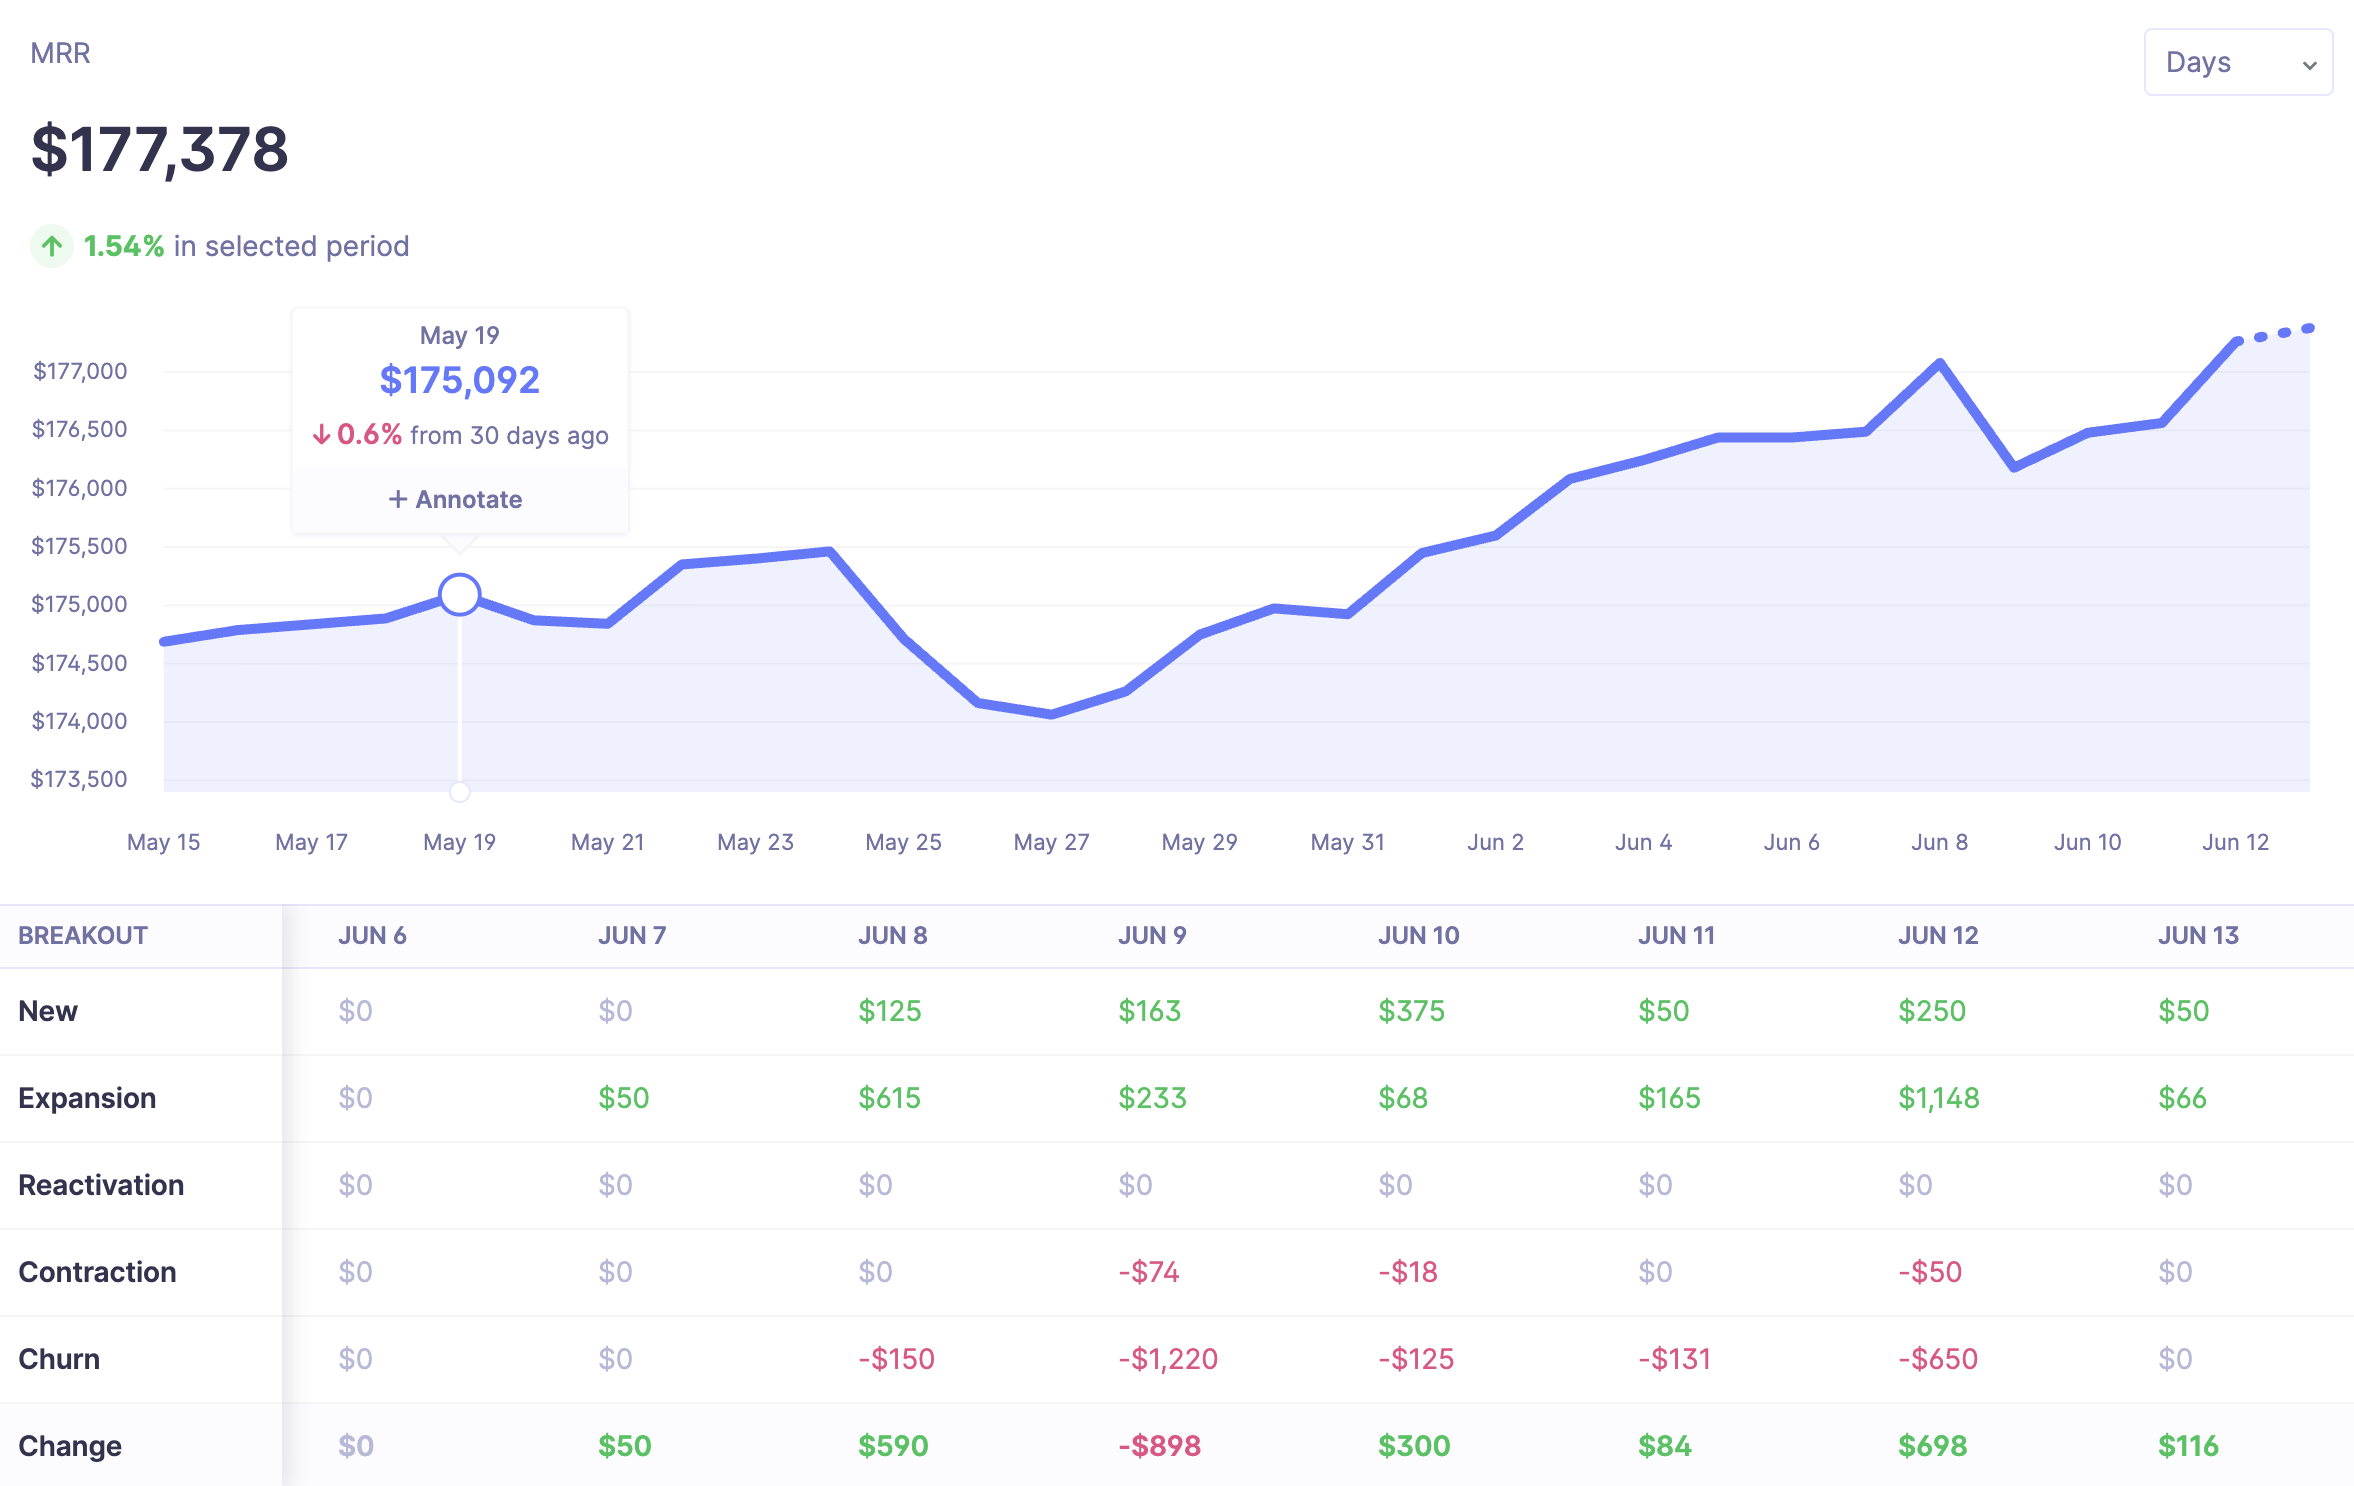
MRR segmentation in Baremetrics
In Baremetrics, MRR segmentation is built directly into the platform. You can filter MRR, expansion MRR, contraction MRR, and churn MRR by any customer attribute or custom segment, giving you a complete view of revenue composition across your subscriber base without manual data work.
How Baremetrics Helps You Track Segmentation Metrics
Baremetrics connects directly to your subscription billing platform, including Stripe, Chargebee, and Recurly to name a few, and makes all four of these segmentation metrics available out of the box. You can filter cohort retention, churn rate, LTV, and MRR by plan type, billing interval, signup date, acquisition source, or custom customer attributes, without building custom queries or exporting data to a spreadsheet.
For teams that need to report on segment performance to leadership or investors, Baremetrics surfaces these metrics in a format that's immediately presentation-ready, including cohort retention charts, revenue composition breakdowns, and churn analysis by customer group. The goal is to give you the segment-level resolution you need to make faster, more confident decisions about where to invest in retention, upsell, and acquisition.
Ready to see what Baremetrics can do for your subscription business? Start your free trial today.


