Table of Contents

Baremetrics makes it easy to understand customer data and make data-driven decisions.
This article will walk you through the process of importing, augmenting, and segmenting customer data to get the insights you’re looking for.
SaaS and subscription businesses rely on Baremetrics for metrics, dunning, customer engagement, and more. Start a free trial today.
Import your data into Baremetrics
If you haven’t already, you’ll need to import data from sources like Stripe, Braintree, and Recurly. If you use multiple data sources, we encourage you to import from those sources, as well. Doing so enriches your data and makes it possible to run complex analyses and get more detailed insights.
It’s important to keep in mind that multiple data sources will combine for some metrics in Baremetrics. This means you won’t be able to break out metrics by individual data source in all graphs.
Connect your first data source
If you haven’t yet, connect your first data source. Allow the import and calculations to finish, and then your dashboard will be displayed.
We have articles that walk you through the steps to connect Stripe, Braintree, Recurly, and for other data sources, you can use our API.
Connect additional data sources
Once you have your first data source in place, head to the Data Connections page in Settings.
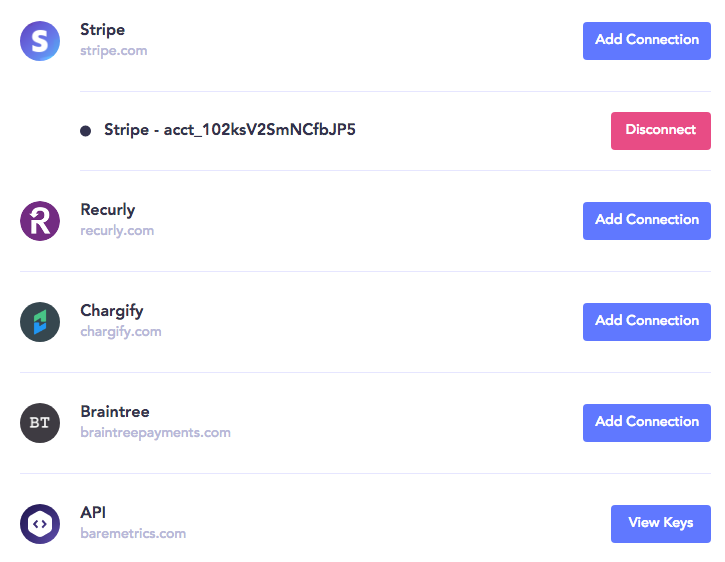
Click on “Add Connection” for the data source you wish to add. You can refer to the platform-specific guides we shared above for additional details.
Augment data
Now that you have a data source in place, you can think about augmenting your data even further. Augmenting your data from external sources via Zapier, CSV files, and our API allows you to enrich your existing data with even more information.
For example, maybe you’re wondering which of your marketing channels is driving more MRR. Or how do the churn rates compare of customers that rated you a 5 NPS score versus a 10.
With Augmentation, you can add those fields to your customer profiles and then segment by those new attributes (we’ll cover segmenting later in the article!)
To start augmenting, head to the Customers tab, right under the filters for Segments.
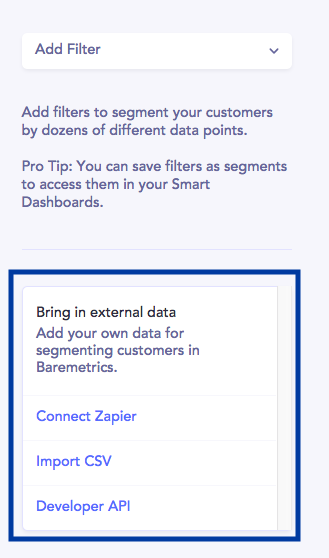
Connecting via Zapier is super simple. For more information, check our guide on integrating with Zapier.
Similarly, connecting with our API is also fairly easy if you have some coding experience.
If you’re looking to connect via .csv, however, there are three things you should keep in mind:
- The file must be in .csv format
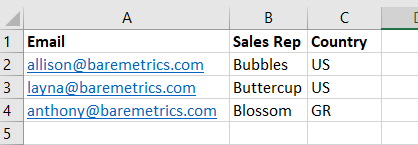
- There must be an email address column. We will tie the attribute to the Baremetrics profile based on the email address provided in this column – so it must match the email Baremetrics has for the customer.
- The new attribute can’t share the name of any of the currently existing attributes. You can see your existing attributes on this management page, or by scrolling through the filters on the Customers tab:
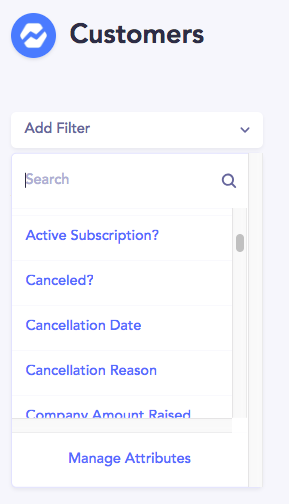
You’ll also have to format your .csv a certain way in order to follow formatting rules.
For example, Date: YYYY-MM-DD
Here’s what a .csv file might look like:
Segment customer data
Now here’s where the fun really begins.
Customer segmentation breaks down metrics into smaller subsets of data. Instead of looking at broad averages, segmented metrics get really specific in dissecting customer behavior.
In other words, segmenting customers in Baremetrics helps you simplify big problems and find data-driven solutions.
With 25+ different attributes, there is a near limitless number of ways you can group your customers to get the information you’re looking for.
Create a segment
Begin in the Customers area of Baremetrics. Then click “Add Filter” on the left hand side and you’ll be able to search or scroll through every attribute available.
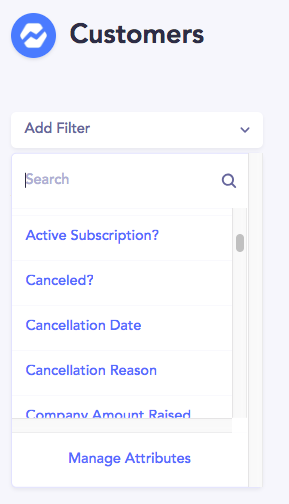
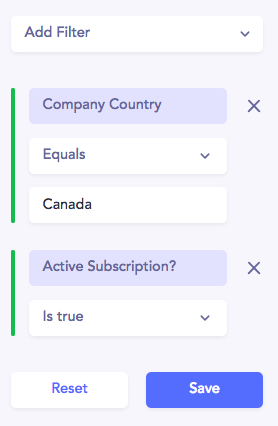
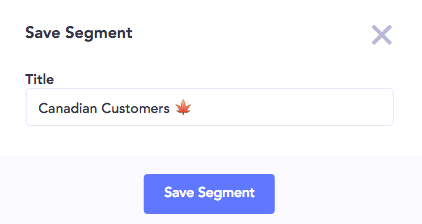
Once you save a segment, you’ll get instant access to the MRR, ARPU, and Active Customers of the segment.

If you want to refer to this segment often, or see its historical data, you can save it.
Comparing Segments
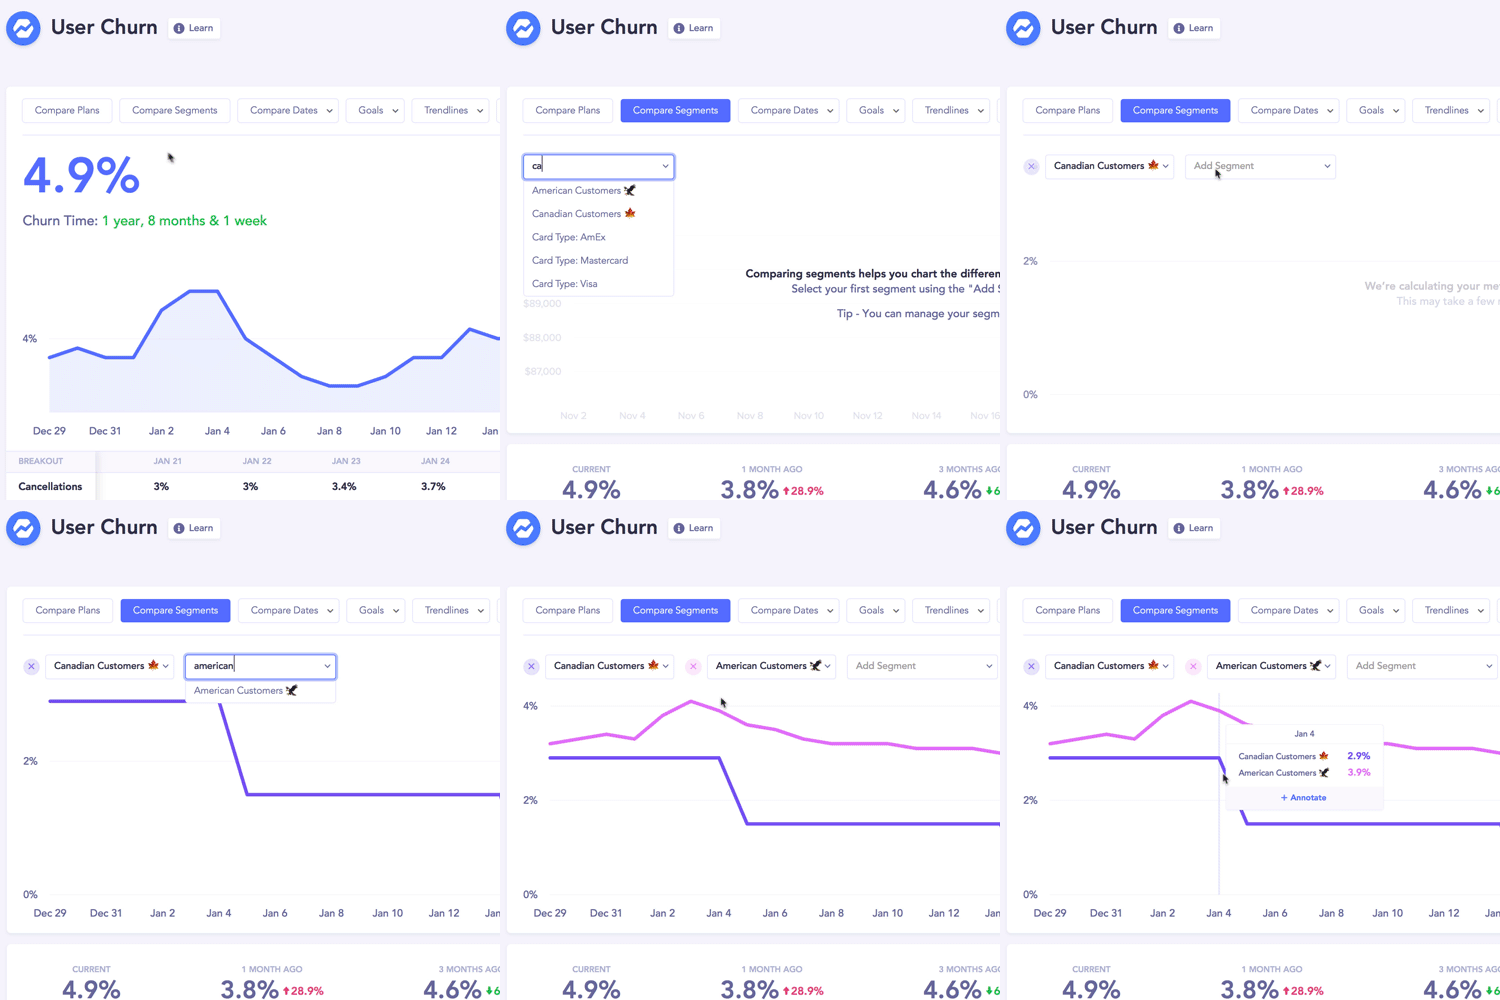
You can compare up to 5 segments at a time across most metrics, including MRR, ARR, User and Revenue Churn, and LTV.
To learn how the Baremetrics team segmented our customer base by:
- MRR by Plan Size
- Revenue Churn by Product Use
- Upgrades by Customer Type
Definitely check out our article Customer Segmentation Examples.
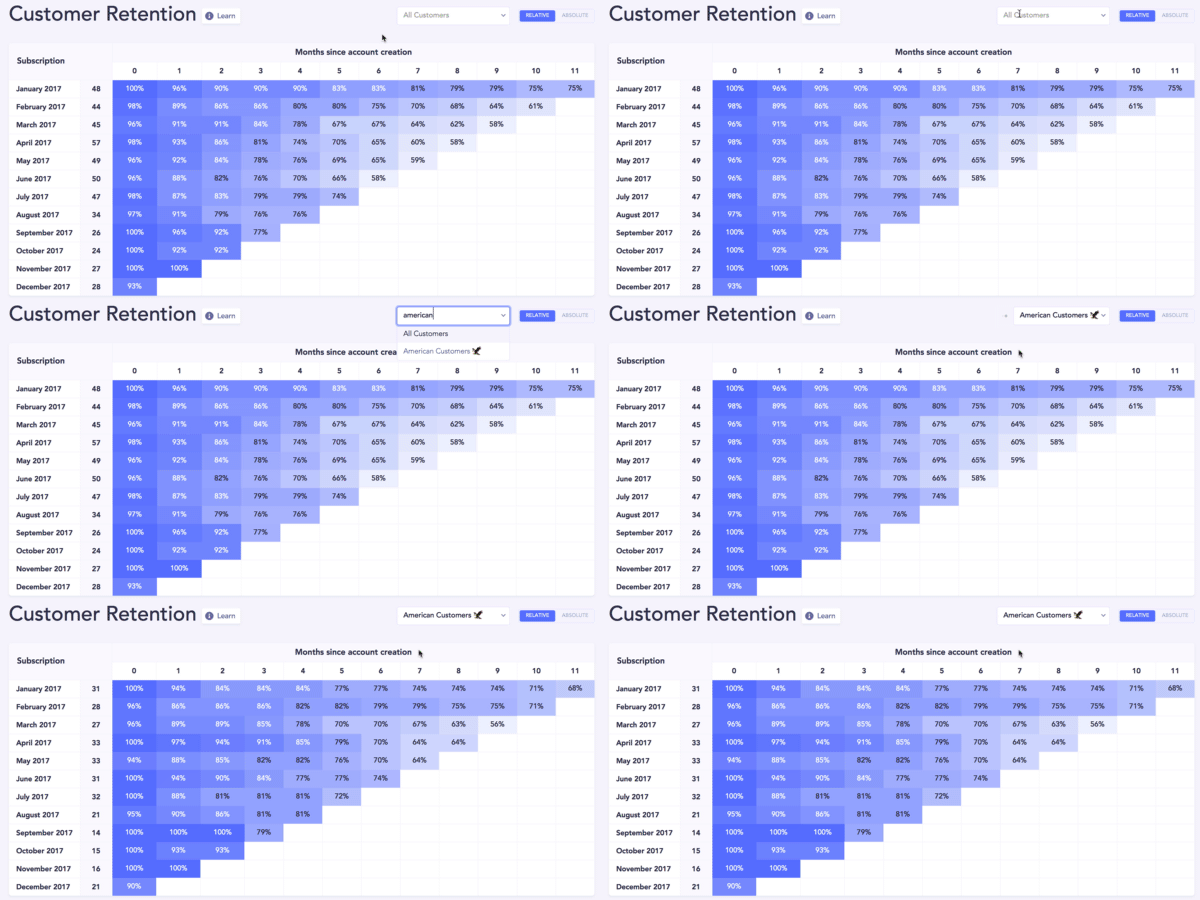
Cohort/retention table by segment
The ever powerful cohort table can be broken down by a segment. Use this to dive into when in the customer lifecycle a particular group of customers tends to churn.
Cohorts are a special segment we use for measuring User Churn and Revenue Churn. Learn more about them!
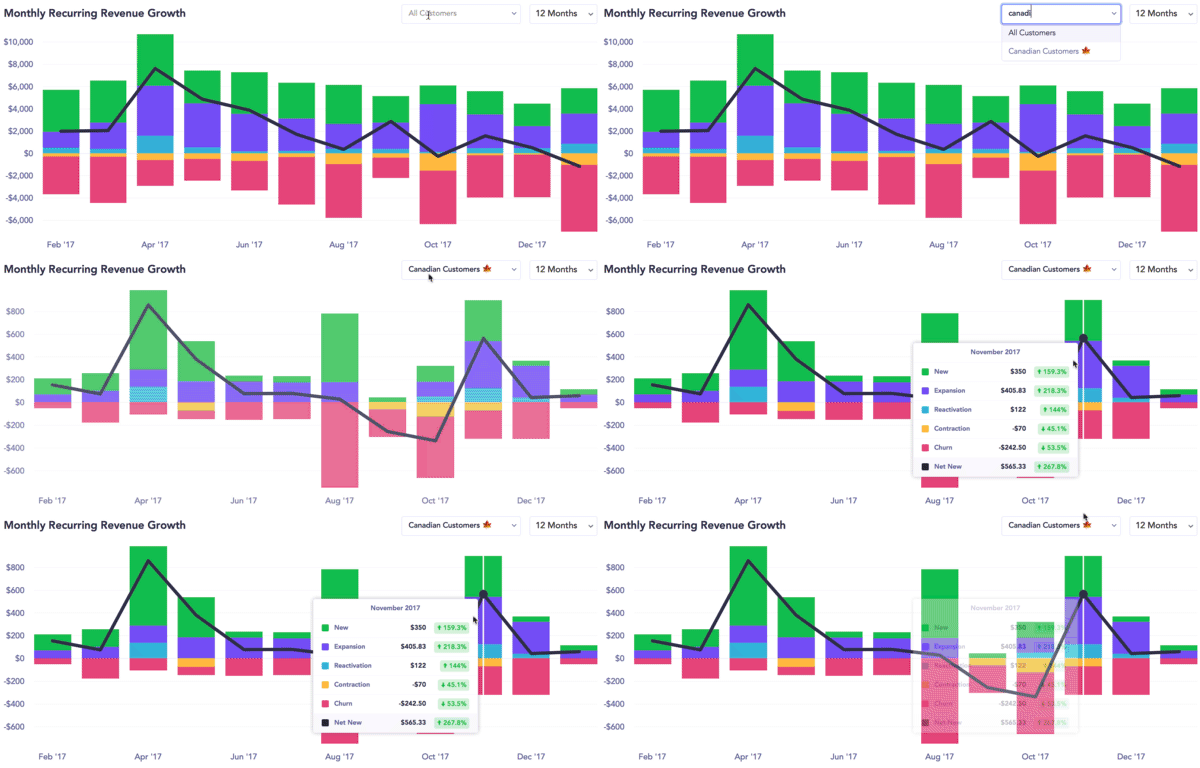
MRR Growth Chart
This graph is super helpful to see the relationship between new revenue and churned revenue month over month.
Conclusion
Baremetrics allows you to organize your customers by attributes that make sense for your business. Track growth, make comparisons, and ultimately make more informed decisions powered by the Baremetrics toolkit.

