Table of Contents

Data plays a key role in maximizing growth in your SaaS company. And when I say “data is key”, I mean only the data that is readily available and accessible to the people who need it.
A lot of information goes unmeasured and unnoticed, and a lot of data isn’t put to good use.
How can you use the data that you have to make well-informed decisions across your company? We recommend you to:
- Use a SaaS metrics tool to get the most out of your data.
- Know how to effectively share your data across your company.
Using a tool like Baremetrics that can keep track of your financial metrics on an easy-to-use dashboard is critical. It enables your company to gain visibility on specific metrics in real-time, enabling teammates to act on changes in your pipeline.
When it comes to your team, everyone in your business needs data that is accurate and consistent to optimize what they do to drive revenue.
In this article, we’re going to break down what data sharing is, why it is important, and how you can share data effectively using Baremetrics.
Let’s go!
All the data your startup needs
Get deep insights into your company’s MRR, churn and other vital metrics for your SaaS business.
What is Data Sharing?
Data sharing is the method of making data available to others through a variety of mechanisms, applications, or users.
The short and the sweet is that you’re simply taking data that you currently have and making it available (ie your team, investors, etc). For the sake of conversation, it’s helpful to understand data visualization as well. Data sharing has to do with the method of sharing and data visualization is how you present data.
What is data visualization?
Data visualization is the presentation of data in a pictorial or graphical format. It enables you as the decision-maker to see metrics presented visually, to better grasp difficult concepts, and to identify new patterns.
With visualization, you can go the extra mile with your data by using tools that create charts and graphs for more detail, interactively changing what data you see and how it’s processed.
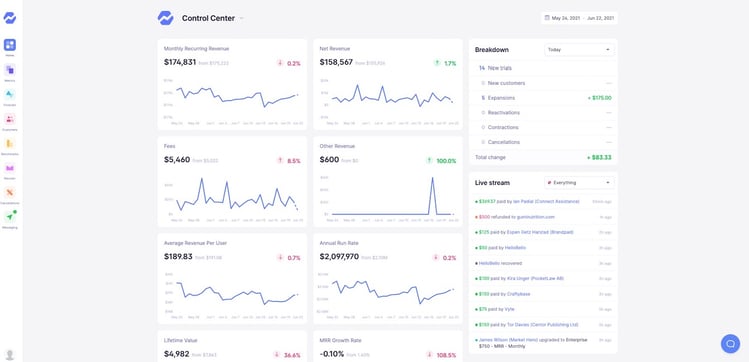
In the screenshot above, you can see a visualization of the entire company’s financial data in one glance. This is effective data visualization.
Why is sharing data effectively important to your SaaS company?
Justin Talerico, SaaS Founder and current GM of Ecommerce at A Cloud Guru say it’s important to share data properly because of two important caveats:
- First, the data you use for KPIs or OKRs must be understood by your teams.
He says that “understood by your teams” isn’t the same as understood by the founder or the C-level. As a founder, you know what your metrics are telling you, but that doesn’t mean your team does. “Ask them to explain it to you”.
If the people on your team are being asked to make decisions that lead to growth, helping them understand the numbers is critical to do so.
- And second, the data must have perceived integrity. They have to know what the numbers mean and trust that they’re accurate. Justin says,
“The other important word is “perceived”. It’s important because even if your data is solid if it’s perceived as shaky or inaccurate, the entire data-driven management process is undermined. Trust is critical to belief. Belief is critical to passion. And passion means the difference between striving to think big and settling for incremental gains.”
To make the wheels go round at your company it takes your entire team being on the same page about how you make decisions.
In today’s world where everything can (and probably should) be measured, feeling confidence in the data you’re sharing and those you’re sharing it with is critical.
Data Sharing with Teammates
Your team is lean, mean, and a data collecting machine. With the tremendous amounts of data that Internet/SaaS businesses gather, establishing a system for processing it all is step one.
After your analytics/ metrics tool is set up, now comes the real challenge: sharing that data across your team. Where should you start?
Here are some tips on some of the best ways to share your data with your team, based on what works for us here at Baremetrics:
Make data transparent
Your team should be able to access any metrics that are relevant to their job. Instead of being bombarded with requests to see X, Y, and Z, why not make your data readily available?
If you’re using Baremetrics, you can do so by creating segmented dashboards to share with your team.
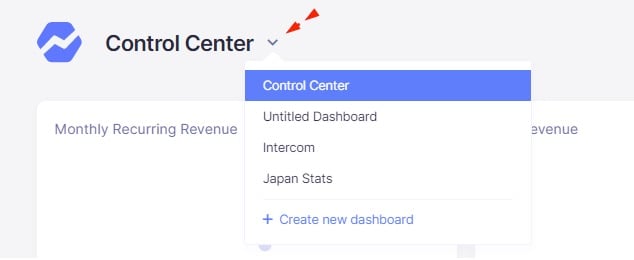
Simply log in to your account → create a new dashboard → title your new dashboard and add the widgets for which metrics you’re wanting to track.

If you’re wanting to bypass that and share your entire dashboard with each team member, that’s an option that others go with as well:
“I share the dashboard with our internal employees, and they’re able to monitor how we’re doing.”
Make data easy to consume
Having access to the necessary data isn’t enough, you and your team need to be able to make sense of your key metrics. Remember what Justin Telarico said, your numbers “must be understood by your team”.
One way we do this here at Baremetrics is by coaching our team to understand and use our publicly accessible dashboards.
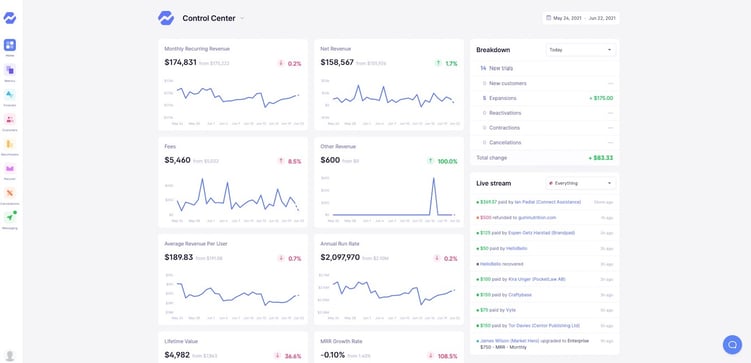
Nobody is perfect so some people may misuse the data or make false assumptions.
At Baremetrics we’ve prioritized a user-friendly and minimalist UI to make sure users don’t have any barriers to understanding their data. But great education and coaching are also significant. Feel free to pass on the Baremetrics Academy articles to your users so everyone can understand the real impact of this information.

(I just had to.)
Market your data internally with your team
Making your numbers easy to consume is only part of the battle. Your reports are useless if people aren’t looking at them frequently.
You need to get comfortable with marketing and distributing your reports to your company.
Many companies invest a lot of time and energy in marketing internally. For instance, Wix uses different channels such as Slack, Monday.com, and emails to inform their team about new reports and insights on the current metrics. Using tools like these to remind stakeholders about all that’s at their disposal is a solid way to create engagement across your company.
Here at Baremetrics, our team utilizes similar channels to bring attention to the entire team:

To amplify your internal marketing, we suggest sharing cool insights or team wins:
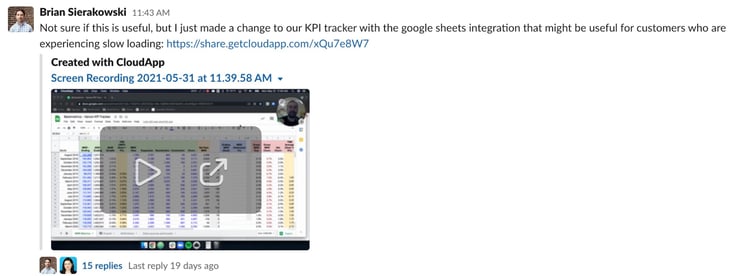
Using channels to share insights is key to both educating your team on what’s relevant to your company and helping everyone make better data-driven decisions.
Want to Reduce Your Churn?
History Hit uses Baremetrics to measure churn, LTV and other critical business metrics that help them retain more customers. Want to try it for yourself?
Join the Open Startups Initiative
Being totally open with your team about what’s under the hood is something that can be extremely beneficial.
Openness with your company adds humanity to something that’s generally thought of as faceless. This helps you to connect with customers and offer a service with integrity.
Companies and startups had been historically tight-lipped about things like revenue numbers and customer retention. In 2015, here at Baremetrics, we opted to go against that grain. And our Open Startups initiative was born.
This initiative has been our attempt to highlight companies willing to be radically transparent with their teams and customers — join the movement today!
Data Sharing with Investors
Sharing data with your team is one thing, but doing so with other stakeholders such as key investors or advisors is another.
“While senior stakeholders are keen to understand why decisions are made, they are largely unfamiliar with the complexity and nuances of the data itself. They want to see the bottom line, and the net effect of the data.” (source)
Since senior stakeholders aren’t a part of the daily operations, you will need to be more strategic and consistent with how you share data. Here are a few suggestions on how to do that:
You can see these metrics directly in your Baremetrics dashboard.
Those are the basic questions anyone running, advising, or investing in a SaaS company needs to know because they give you direct insights into how your company is doing.
Create and share more in-depth reports
We spoke earlier about creating straightforward dashboards for team members on metrics that are relevant day-to-day.
The real fun comes in when you go deeper and take advantage of segmentation and data augmentation, which can be helpful when presenting to key investors or advisors.
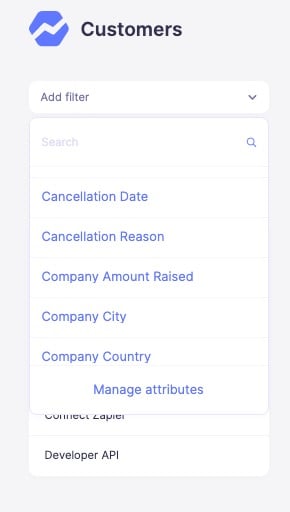
Being able to connect other data sources like your CRM, marketing automation tool, and others can help you answer more advanced questions, like:
- Which plan levels have the highest churn?
- Which referral sources have the highest LTV?
- What country is most of our MRR coming from?
Having data to answer these questions gives greater context for those making the business decisions, instead of just guessing and making assumptions.
For instance, if you notice an increase in MRR from a specific region, you could put more marketing dollars towards them. Or if one plan is resulting in higher churn than the others, you can dive into why.
I won’t dive into it here, but we also have some add-on products you can use to get analytics for customers who cancel and even failed charges.
Send screenshots of your Baremetrics dashboard
Don’t underestimate the power of simply taking a screenshot and sending updates that way. Modern tools like CloudApp, Loom, or the good ol’ Shift + Command + 4 will do the trick.
Hear from another one of our customers on how this simple method works for them:
“We send monthly emails with our MRR and ARR numbers. For quarterly board meetings, we have screenshots of the dashboarding modules and draw through them.”
Make sense of your data with Baremetrics
To grow your SaaS, you can’t ignore the data. In the same breath, how you share your data within your team and amongst key stakeholders is just as important.
That’s why your team should use a tool like Baremetrics, a SaaS metrics tool that provides 26 different metrics about your business, such as MRR, ARR, LTV, total customers, and more.
Baremetrics integrates directly with your payment gateways and other tools, so the necessary data about your customers is automatically piped into the Baremetrics dashboards.
be honest
How well do you know your business?
Get deep insights into MRR, churn, LTV and more to grow your business


