Table of Contents

SaaS founders comparing Baremetrics and ChartMogul usually arrive at this page after one of two triggers: they've outgrown Stripe's native reporting, or they've been running their metrics in a spreadsheet that's "one bad paste away from breaking." Either way, you already know you need a dedicated subscription analytics tool. This article skips the category explainer and gets straight to the comparison.
Here's the honest framing: Baremetrics and ChartMogul are genuinely close on core SaaS metrics. Both track MRR, ARR, churn, LTV, and cohort retention accurately. The real differences show up in three places — financial forecasting depth, revenue recovery tooling, and support model — and those differences matter a lot depending on where you are in your growth stage.
Founders who start evaluating subscription analytics tools typically do so because they're tired of:
- Stripe telling them nothing useful. Stripe processes payments. It doesn't calculate NRR, cohort retention, or expansion MRR — and when founders try to get those numbers from Stripe exports, the math rarely ties out cleanly.
- Running MRR in Google Sheets. "I have 30 sheets that I'm keeping up and it's just been crazy" is almost word-for-word what RevOps leads say when they finally book a demo. The spreadsheet works until it doesn't, and when it breaks it takes your whole reporting model with it.
- Finding out about problems too late. A $5K customer churns silently. Failed charges pile up unrecovered. An expansion opportunity disappears because no one saw the signal. Dedicated analytics exists to surface these things before they compound.
- Being unable to answer basic questions on demand. "What's our churn by acquisition channel?" "What's our runway if growth slows 15%?" "What's our burn rate this quarter vs. last?" These questions require a new spreadsheet every time — or a CFO-level tool that connects your SaaS metrics to your actual P&L.
Below is a full breakdown of how both tools compare on the things that actually matter at the decision stage.
Want to see the numbers before you read further? Start a free Baremetrics trial — most teams connect their billing data and have a live dashboard in under a day.
Quick Comparison Table
| Capability | Baremetrics | ChartMogul |
|---|---|---|
| Core SaaS metrics (MRR, ARR, churn, LTV) | ✅ Full | ✅ Full |
| Segmentation | ✅ Unlimited segments + unlimited custom dashboards | ✅ All plans (dashboard caps on lower tiers) |
| Financial forecasting (P&L, runway, burn rate) | ✅ Forecast Plus — connects to QuickBooks/Xero | ❌ Subscription revenue modeling only |
| Failed payment recovery (dunning) | ✅ Recover — fully customizable, tiered flat fee, Stripe only | ❌ Not included |
| Cancellation Insights | ✅ Native widget + reason capture + follow-up sequences | ❌ Not included |
| Native CRM | ❌ Integrates with HubSpot | ✅ Fully built, ships on all plans including free |
| Free tier | ❌ Starts at $49/mo | ✅ Free up to $10K MRR |
| Support | ✅ Unlimited calls + ~2 min chat response | ⚠️ Mixed — responsive at higher tiers, slow at lower |
| Slack + Intercom native integrations | ✅ | ✅ |
| Multi-source normalization (Stripe + Apple + Google) | ✅ | ✅ |
| Data warehouse export (Snowflake, BigQuery, Redshift) | Via API and Zapier | ✅ Pro and Enterprise (native push) |
| PayPal / GoCardless native integration | Via API | ✅ Native |
| Pricing model | Scales with MRR | Scales with ARR |
Baremetrics: Feature Walkthrough
Core Metrics Dashboard
Baremetrics pulls from your billing systems — Stripe, Braintree, Chargebee, Recurly, Apple, Google, and Shopify — and builds a live subscription analytics dashboard without manual setup. You get every standard SaaS metric (MRR, ARR, LTV, ARPU, churn rate) calculated automatically and updated in real time as transactions come in.
A few things that make the core dashboard more than a metrics viewer:
MRR movement breakdown by type. New MRR, expansion MRR, reactivation MRR, contraction MRR, and churned MRR are all broken out separately — not just net change. This is the difference between knowing your MRR went up $3K and knowing why it went up $3K (new customers vs. expansions vs. less churn than last month).

MRR movement breakdown by type in Baremetrics
Customer-level timeline. Every charge, upgrade, downgrade, failed payment, and plan change for every individual customer, visible in one place. When a big account goes quiet or changes their plan, you see it without hunting through Stripe.
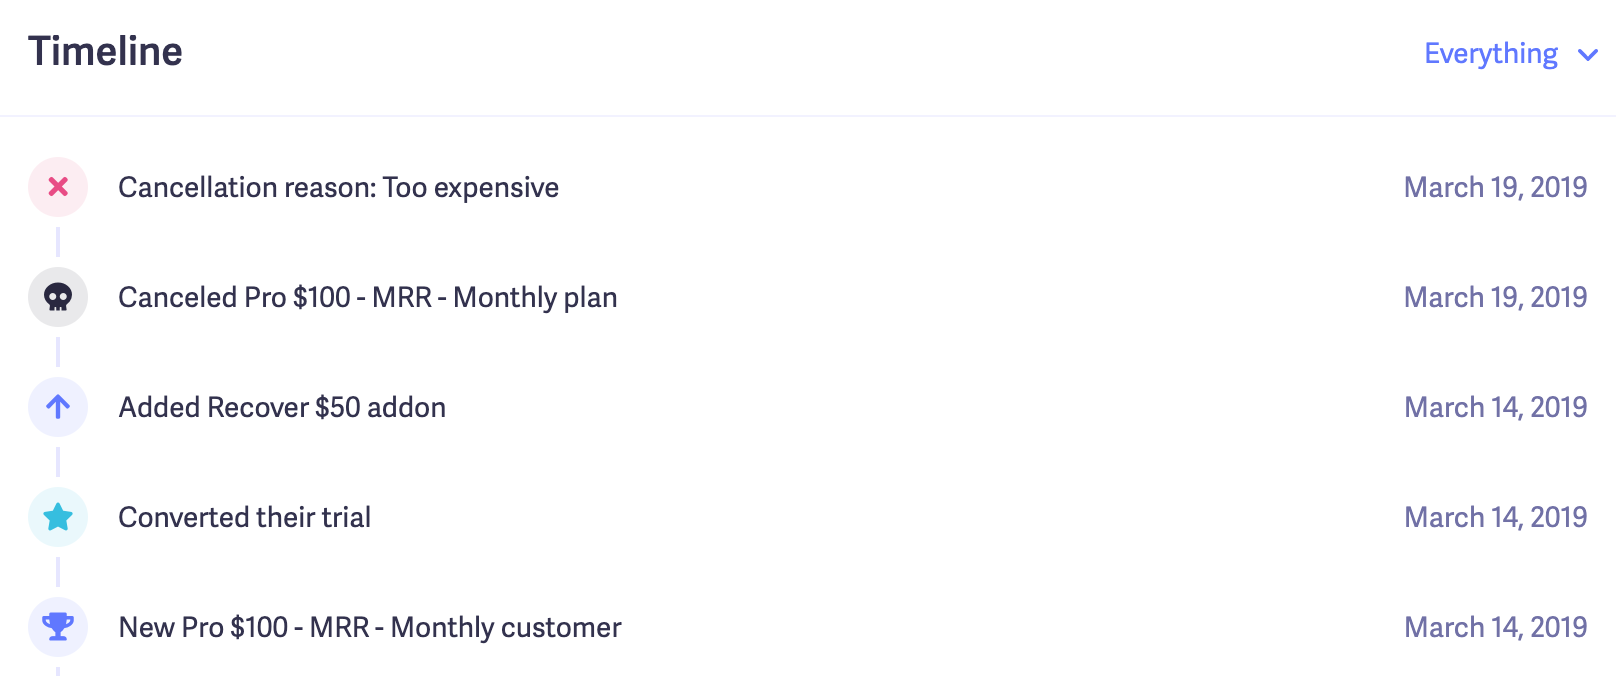
Customer timeline in Baremetrics
Cohort retention tables. Month-by-month retention by customer cohort, so you can identify exactly where customers are dropping — month 1, month 3, month 12 — and build retention programs around the actual drop-off points instead of guessing.
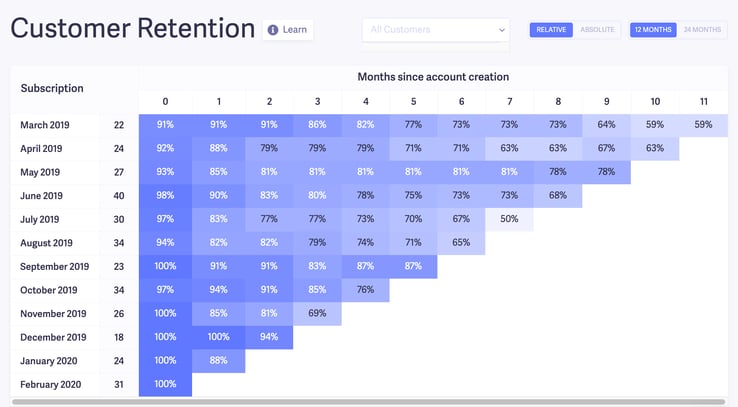
Retention tables in Baremetrics
Live event stream. A real-time feed of every transaction from your payment processor, so your team can see what's happening without logging into Stripe.
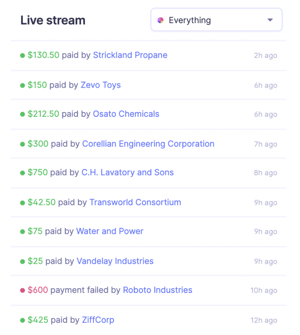
Live feed in Baremetrics
Annotations. Mark events directly on graphs, like a pricing change, a marketing push, or a product outage, so when you look back at a dip or spike, you know what caused it.
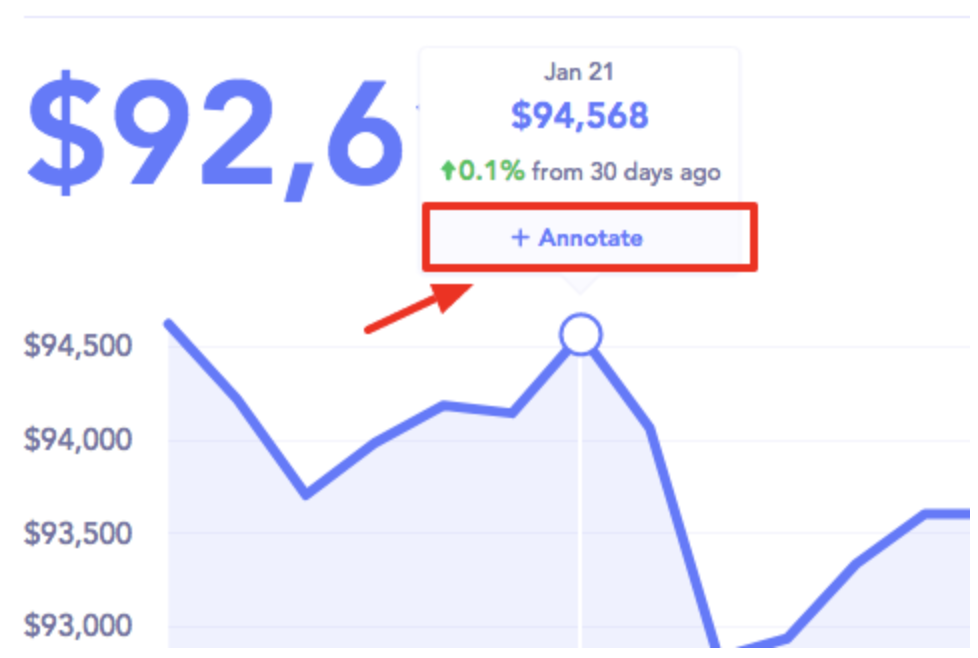
Annotations in Baremetrics
Multi-source normalization. If you run billing across Stripe, Apple App Store, and Google Play, Baremetrics pulls all three into one unified MRR number. You can also segment by source and see your Apple MRR vs. Stripe MRR on the same graph.
Segmentation and Custom Dashboards
Segmentation is where Baremetrics has a meaningful depth advantage. You can build unlimited segments and unlimited custom dashboards from any combination of attributes — country, plan name, price tier, billing cadence, marketing attribution tags, or any custom attribute you push in via API, HubSpot, or Intercom.
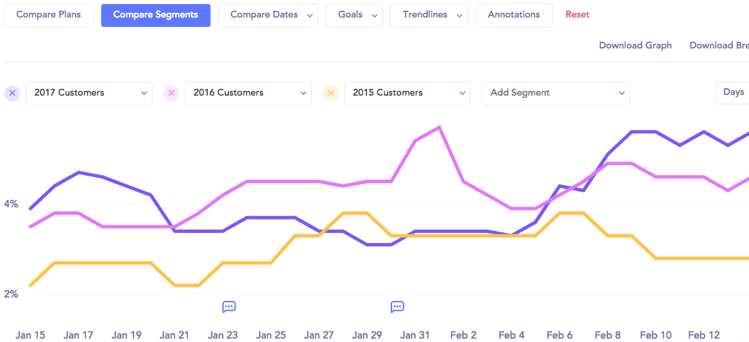
Deep Segmentation in Baremetrics
The practical application: an Ops lead can build a "US annual plan customers over $200/month" segment, put it on a dedicated dashboard, and share that view with the leadership team. A founder can compare monthly vs. annual cohort retention side-by-side on the same graph. A growth team can segment by acquisition channel using HubSpot attributes synced into Baremetrics.
ChartMogul also has segmentation on all plans, so this isn't a Baremetrics-exclusive capability. The difference is in how segments connect to unlimited custom dashboards (ChartMogul caps dashboards at 5 on lower tiers and 15 on Enterprise) and the depth of attribute enrichment available via API and native integrations.
Forecast+ Financial Forecasting
This is Baremetrics' clearest differentiator against ChartMogul, but the framing matters, because the word "forecasting" means different things in each product.
ChartMogul forecasting is subscription revenue modeling: it takes your ARR and projects what it looks like in 12 months under different growth assumptions. It stays entirely within the SaaS metrics layer. Useful, but limited.
![Forecast+ Dashboard [Screened in]](https://baremetrics.com/hs-fs/hubfs/Forecast+%20Dashboard%20%5BScreened%20in%5D.png?width=749&height=413&name=Forecast+%20Dashboard%20%5BScreened%20in%5D.png)
Forecast+ in Baremetrics
Baremetrics Forecast+ is full financial forecasting: it connects natively to QuickBooks Online or Xero (or accepts CSV/spreadsheet imports of your P&L), ingests your actual expenses line-by-line, and builds a CFO-level dashboard that includes:
- Runway (how many months of cash you have left at current burn)
- Burn rate (fixed vs. variable, by department)
- P&L projections (revenue vs. expenses vs. net profit margin)
- Budget variance (actuals vs. budget, month by month)
- Customer Acquisition Cost (CAC), pulled from SaaS metrics + expense data
- Scenario planning with Target, Worst Case, and Base Case models
- Revenue modeling with adjustable growth and churn levers
When you close your books, sync Forecast Plus and the dashboard updates in seconds. The practical outcome: founders can walk into an investor conversation with runway, burn, and key SaaS metrics in one place — not stitched together from three different tools.
Recover: Failed Payment Recovery
The average SaaS company at $50K–$100K MRR loses $15–20K per month to failed payments with no automated recovery process. Baremetrics Recover is a built-in dunning tool that runs the entire recovery process without you touching it after setup (roughly 30 minutes to configure).
Here's exactly how Recover works:
When a charge fails, Recover triggers automatically and starts a customizable email sequence with up to 7 emails for failed charges, all editable: your sender name, your subject line, your copy, and your logo. This is not a generic "please update your payment info" email. It goes out from your brand, in your voice, with a branded billing widget where the customer updates their card directly to Stripe. No card data is stored by Baremetrics.
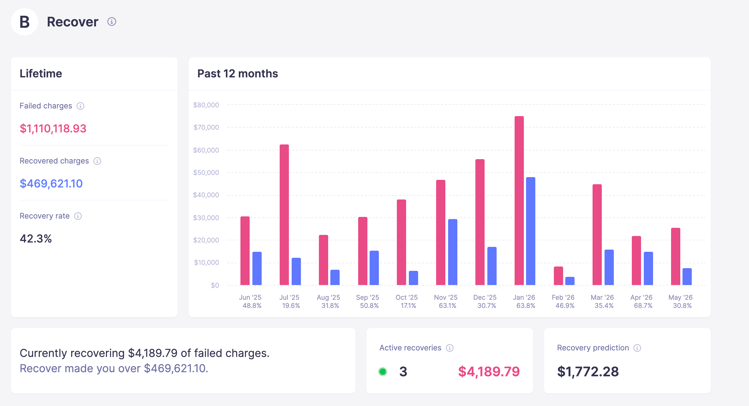
Recover Dashboard in Baremetrics
Beyond the failed charge sequence, Recover also sends:
- Annual renewal reminders (2 emails) — proactive outreach before a renewal comes due, reducing involuntary churn before it starts
- Credit card expiration warnings (2 emails — at 30 days and 7 days before expiry)
- In-app banners — displayed when a delinquent customer logs in, during a configurable grace period
- Paywall — after the grace period, the banner becomes a full paywall locking the customer out until payment is updated
- SMS recovery — optional, billed per message
The recovery dashboard tracks failed charge amounts, recovery rate by email, amount recovered, and per-email performance (opens, clicks, recoveries). On average, Recover pays for itself 38x over. No commission is taken on recovered revenue — it's a tiered flat fee based on your MRR.
Important: Recover currently only works with Stripe, Braintree, and Recurly customers. If your billing runs on Shopify or another processor, Recover is not available to you.
Cancellation Insights
Cancellation Insights is a churn-capture tool that runs at the exact moment a customer decides to leave — before they're gone.
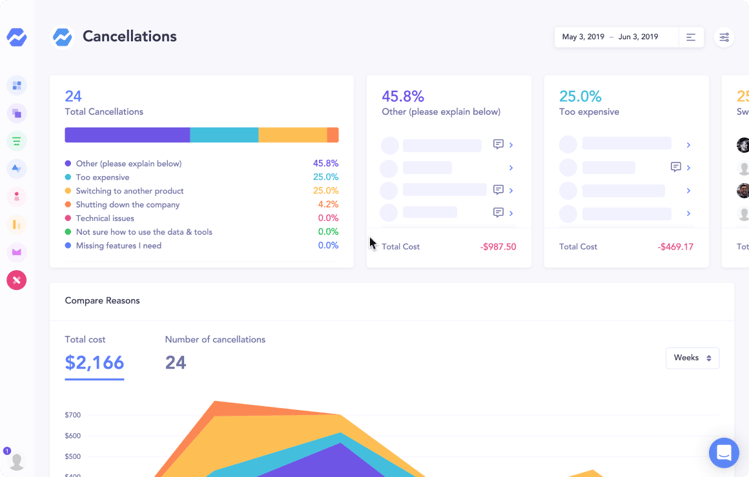
Cancellation Insights in Baremetrics
Here’s how it works: a Baremetrics widget installs on your cancellation button. When a customer clicks "Cancel," a survey pops up before the cancellation is processed. You configure the cancellation reasons (too expensive, switching to a competitor, not using it enough, technical issues, etc.). The customer selects their reason. Then a follow-up email sequence triggers — personalized to the reason they selected.
The "too expensive" cancellation gets a discount offer. The "switching to a competitor" cancellation gets a feature comparison. The "not using it" cancellation gets an onboarding nudge. All of this runs on autopilot after the 30-minute setup.
The Cancellation Insights dashboard shows all cancellation reasons by volume, recovery rate by reason, churn data, failed charge data, and emails sent. It turns what used to be an unknown data black hole — "why are customers really leaving?" — into something you can report on and act on to actively reduce churn.
Support Model
Baremetrics offers unlimited onboarding calls, unlimited working sessions, and a ~2 minute chat response time. There's no support tier where you're restricted to email-only. If you want someone to build your first dashboard with you, book a call. If you're three months in and want to set up a new segment, book a call.
This matters more than it sounds. Multiple Baremetrics prospects who came from ChartMogul specifically cited that ChartMogul support at lower tiers is "fairly unresponsive" — a point echoed in G2 and Product Hunt reviews. When you're setting up a new analytics tool and running into data reconciliation questions, response time is the difference between getting value quickly and abandoning the setup halfway through.
ChartMogul: Where It Might Be a Better Fit
Honest comparison is the point here, so let's be direct about where ChartMogul might be a better match for your needs.
1. Native CRM — fully shipped and included on every plan
ChartMogul's CRM is live and included on every plan, including free. It includes opportunity management, tasks, @mentions, email outreach, and sequencing (CRM Pro adds more). For SaaS teams that want to manage sales and customer success workflows inside their analytics tool — without a separate CRM — this is a genuine advantage. Baremetrics connects to HubSpot but doesn't have a native CRM layer.
2. Free tier up to $10K MRR
ChartMogul is genuinely free for companies under $10K MRR. That free tier includes core analytics, segmentation, subscription revenue modeling, benchmarks, and a CRM seat. Baremetrics' lowest entry point is $49/month. For pre-revenue or very early-stage founders who purely need core metrics and nothing else, this is meaningful.
3. Broader native billing integration support
ChartMogul supports PayPal and GoCardless natively. Baremetrics does not offer native integrations for these processors, though both can be connected via the Baremetrics API. If you need a native, out-of-the-box integration without custom development work, ChartMogul has the advantage here.
4. Data warehouse exports
ChartMogul Pro and Enterprise support pushing data directly to Snowflake, BigQuery, Redshift, S3, and Azure. Baremetrics surfaces your data via API and Zapier, which gives you flexibility but requires more setup. For data-mature teams that need a direct, no-code push to their existing data warehouse, ChartMogul has the native advantage.
Pricing Breakdown
Baremetrics
- Accelerator: $49/month (up to ~$30K MRR)
- Scales with MRR above that
- Recover and Cancellation Insights are add-ons
ChartMogul
- Free: up to $10K MRR (includes CRM seat, core analytics, subscription revenue modeling)
- Starter: $59/month (annual) or $69/month (monthly)
- Scale: higher tier with expanded dashboard limits and features
- Enterprise: from $19,900/year
- CRM Pro: $39/user/month (1 free seat included on all plans)
- Startup program: $50/month discount for 12 months on any paid plan
The pricing reality for most buyers:
| MRR Stage | ChartMogul | Baremetrics | Practical winner |
|---|---|---|---|
| Pre-$10K MRR | Free | $49/mo | ChartMogul |
| $10K–$30K MRR | $59–$69/mo | $49/mo | Baremetrics |
| $30K+ MRR | Scales with ARR | Scales with MRR | Competitive — contact for a quote |
The inflection point is precise: Baremetrics' pricing advantage kicks in exactly at the $10K–$30K MRR range, which is also exactly where founders typically outgrow "just metrics" and start needing forecasting, dunning, and churn tooling. ChartMogul's free tier is real and worth using if you're pre-$10K and purely need core metrics. The moment you outgrow it, Baremetrics is cheaper and includes significantly more.
Who Should Choose Which Tool
Choose Baremetrics if:
- You're at $10K+ MRR and need more than a metrics dashboard — forecasting, dunning, and cancellation tooling matter to you
- You want financial forecasting that connects your SaaS metrics to your actual P&L, runway, and burn rate (QuickBooks/Xero)
- You're losing revenue to failed payments and want a fully branded, customizable recovery sequence with a tiered flat fee (not commission-based)
- You want unlimited calls with a support team that will help you set everything up
- You run billing across Stripe + Apple + Google and need a unified MRR view
- You're switching from a spreadsheet-based setup and want hands-on onboarding
Choose ChartMogul if:
- You're pre-$10K MRR and want a genuinely capable free tool to start with
- You want a native CRM built into your analytics platform without connecting HubSpot
- Your billing runs on PayPal or GoCardless and you need a native integration
- You need to push SaaS metrics data directly to Snowflake, BigQuery, or another data warehouse
- You have a data-mature team already running BI tooling and need a no-code direct integration
The Bottom Line
If you're pre-$10K MRR and purely need core metrics, ChartMogul's free tier is genuinely good and there's no reason not to use it. If you're past $10K MRR — especially if you're losing revenue to failed payments, struggling to explain your financials to investors, or flying blind on churn reasons — Baremetrics gives you more capability for a lower price than ChartMogul's paid tiers, plus hands-on support that shows up when you need it.
The question isn't really "which tool has better metrics dashboards." They're comparable. The question is whether you need what lives outside the dashboard: forecasting, recovery, churn capture, and a team that picks up the phone.
Start your free Baremetrics trial and see your SaaS metrics in a live dashboard today.

