Table of Contents

Before people ever started calculating growth rates for economic activity, governments used the growth rate formula to determine population growth. Ever since then, calculating growth rates has become an essential tool for almost everything.
In SaaS, you need to calculate the growth rate for a handful of different metrics. For example, you need to calculate the growth rates for monthly recurring revenue (MRR), active customers, average revenue per user (ARPU), and more.
One easy way to do this is to use Baremetrics to calculate the growth rates for your SaaS metrics. Get on the Baremetrics free trial, and check out what it looks like!
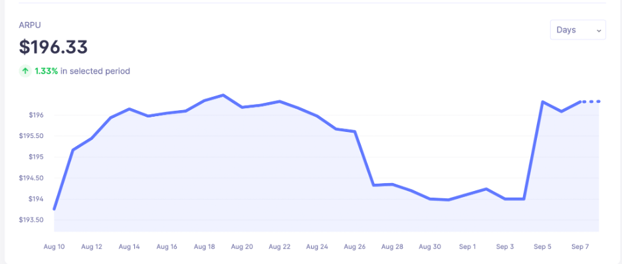
Here’s an example of calculating the ARPU growth rate with Baremetrics:
You can see the ARPU growth rate automatically displayed in green under your ARPU amount.
What is a Growth Rate?
A growth rate is a term that describes the change (in percentages) of a variable over a specific period.
i. Growth rates in population
For example, let’s look at growth rates for populations. A positive growth rate for a population would indicate there’s a higher rate of births, or a lower rate of deaths. The growth rate of a population would be written as a percentage change over a year. For example, the population of Tokyo grew by 0.1% over 2020. In this example, we could say that Tokyo grew from a population of 1,000,000 people on January 1st, 2020, to 1,001,000 people on January 1st 2021.
A growth rate shows the percentage increase of a value, such as a population, over a given period of time.
ii. Growth rates in personal financial savings
Growth rates can also be applied to personal finance. For example, the growth rate of our savings was 20% year over year. That means the amount of money we have saved this year is 20% more than last year.
iii. Growth rates in business
Growth rates are also popular when looking at how businesses grow or change. If you’re considering whether or not to invest money in a certain area of business, you might want to look at how that area of business is growing.
With an understanding of a company’s growth rate, investors can often predict future performance and make better investment decisions.
For example, you might look at the revenue of the business. Is the amount of revenue increasing? If it is, that might be a good indicator of potential.
For businesses, you can use Baremetrics to measure growth rates quickly. Check out the MRR growth rate here from a real Baremetrics dashboard:
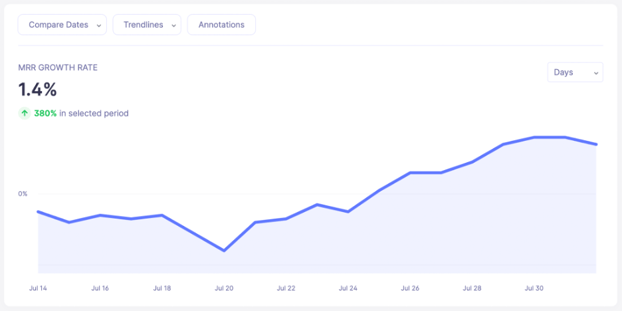
You can see all of the Baremetrics metrics in the live demo, or sign up for the Baremetrics free trial to start using it now!
Compare MRR from different months
Get deep insights into MRR, churn, LTV and more to grow your business
What is the Growth Rate Formula?
The Growth Rate formula is:
Growth rate = ((End Value) – (Beginning Value)) / (Beginning Value)
Since growth rate measures change over a specific time, values from one period (e.g., August) can be compared against calculated values from the previous period (i.e., July). In this case, values from August serve as the end value while values from July serve as the beginning value.
You can have both positive growth rates and negative growth rates. If the growth rate is positive it indicates growth or expansion, if it’s negative it indicates contraction.
What are the most important growth rates in SaaS?
Growth rates are calculated for different metrics for SaaS companies. The growth rate of active customers, for instance, differs from the growth rate of bookings in a SaaS business.
The most important growth rates in SaaS include:
- Customer Lifetime Value
- Costs of Customer Acquisition
- Monthly Recurring Revenue (MRR)
- Annual Recurring Revenue (ARR)
- Expansion Revenue
- Signup Rate
- Churn Rate
- Net Promoter Score
Unlike the growth rate types for traditional companies, such as trailing growth rates or forward-looking rates, SaaS companies utilize the growth metrics listed above.
The values from these metrics give SaaS businesses a hands-on understanding of their financial health and projections for future growth. Even better, these growth metrics can be weighed against industry benchmarks to analyze growth within the proper context.
What growth rates can you measure with Baremetrics?
Growth rates are an essential yardstick in measuring your business’s profitability and sustainability. This measure helps all interested parties understand the speed at which a company is growing and helps leaders make projections for the future.
With Baremetrics, you can get a bunch of growth rates for your metrics.
1. The growth of active users
Many companies commit the honest error of lumping their paying customers together with users on a free trial. When users have been lumped together in this way, these companies often measure the number of users, forgetting that there’s an important distinction between paying customers and customers on a free trial.
Of course, all users are significant. Users on free trials may eventually become paying customers. Still, keep in mind that it’s the paying customers that keep the lights on. Knowing how your active customers are growing is a good indicator of your company’s health.
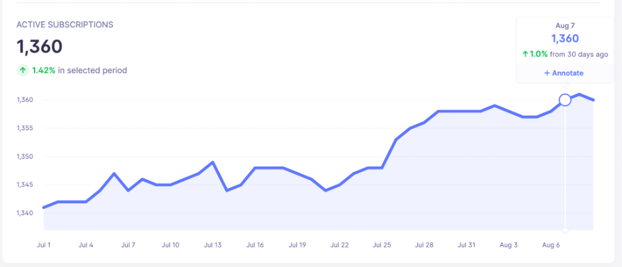
Here’s an example of monitoring the growing number of active subscriptions to your SaaS:
2. Changes in Monthly recurring revenue (MRR)
The monthly recurring revenue is the total revenue gained from your business every month. One-off payments like setup fees or consultation fees are not part of the MRR. The revenue counted as part of the MRR is recurring payments, such as a monthly subscription.
The Baremetrics MRR tracking shows you the growth rate of your monthly revenue. You’ll be able to compare MRR from different months and see if it’s increasing, decreasing, or just remaining constant. If you have a substantial decline in MRR, it could indicate that your customers are churning at a higher rate than usual. Do you need to increase your efforts at bringing new customers?
A clear understanding of your sources of revenue and the data from your MRR can give you an added advantage in creating a growth strategy. You’ll also need to know what channels to persist on and which ones aren’t bringing much ROI. As you may already know, MRR is not an independent metric, it’s interconnected with other metrics that aim to give you a holistic view of the financial health of your business. With Baremetrics, you can keep an eye on your MRR and its interplay with other vital metrics.
3. Churn Rate
Churn rate is the percentage of revenue or customers lost within a given timeframe. The most essential type of churn include:
- Revenue churn: percentage of revenue lost.
- Customer churn: percentage of customers lost.
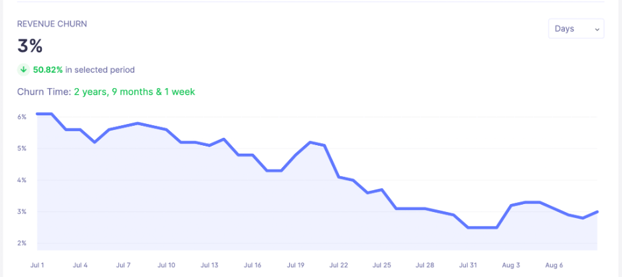
Both customer and revenue churn show your losses in terms of customers and revenue. Churn is checked monthly, and it shows you how many customers you are losing from canceled subscriptions, while revenue churn shows you how much MRR you are losing from all the canceled subscriptions.
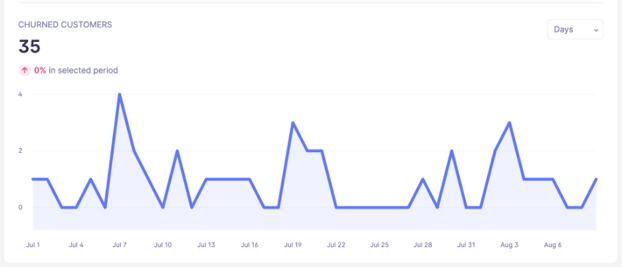
Here is an example of the rate of change for churn:
And check out this example of revenue churn from the baremetrics demo page:
4. Expansion MRR
When your existing users bring in more revenue by upgrading to a higher plan or purchasing an add-on service from your business, the new revenue is the expansion MRR. You can also track this metric with Baremetrics.
Some businesses build their user experience to encourage expansion MRR, like upgrading from a user plan to a team or group plan. If your company has made plans for expansion MRR, you can take advantage of the Baremetrics tool and see if your efforts are paying off.
See all of your financial data with Baremetrics
Baremetrics provides a dashboard to track your financial data and its interplay with several other business performance data. Your company’s financial data is essential for several reasons. It provides a glance as well as an in-depth look at the overall health of your business.
Your internal team will also use your financial data to analyze business performance and determine whether tactics and strategies must be changed or improved.
In addition to giving you clear insight into your financial information, Baremetrics shows you how your company performs against industry benchmarks. Look at more of what the Open Benchmarks say here, or start a free trial today!

