Table of Contents
Key takeaways:
- Customer segmentation is vital to fully understanding your audience— and optimizing the customer journey
- You can segment users based on behavioral and demographic data
- Segmenting customers by their MRR and plan size could help you identify customer success opportunities or prioritize marketing and sales resources
- Segmenting by revenue churn and product use to identify potential re-engagement strategies for at-risk users
- Segmenting by upgrades and customer type can help you decide which audiences to target most heavily with new campaigns
Lies, damned lies, and statistics. It’s no secret that numbers can be wildly misleading, and business metrics are no exception.
Yes, metrics are absolutely the most accurate and reliable tools for understanding the financial health of your business. And yes, the numbers are exactly what you should be looking at for leads on how to grow your company. As long as they are the right numbers.
This is where customer segmentation comes in.
Customer segmentation breaks down metrics into smaller subsets of data. Instead of looking at broad averages, segmented metrics get really specific in dissecting customer behavior.
Even larger businesses might think that aggregate data on MRR or churn is reliable enough to monitor your business growth.
But consider this:
Australia experiences both extreme droughts and extreme floods, but you’d never know that from looking at its average annual rainfall of 450mm of rain per year.
Upon seeing this average amount, an umbrella manufacturer might decide to skip on the Australian market, and miss a huge business opportunity in Tasmania where it rains 237 days per year.
The point is that, by only looking at averages, you might be missing something big, like a secret cash cow or massive budget waster.
This article will explain how customer segmentation can help reveal where your business is succeeding, and which products are simply draining resources and slowing you down. We’ll walk through three real-life customer segmentation examples using Baremetrics data and tools.
How Customer Segmentation Works
Before we dive into the customer segmentation examples, let’s cover a few of the basics first:
- Using customer segmentation tools like Baremetrics is the easiest way to automatically segment users to get clear insights (and visual representations of that data!)
- You can segment users by behavior or traits like location; you can learn more about customer vs. market segmentation to see when to use each segmentation option
- Leveraging segmentation metrics like MRR or LTV segmentation can help you discover high-value customers and learn more about them
In this post, we’re going to be using Baremetrics customer segmentation dashboard to highlight different segmentation examples.

1. MRR by Plan Size
For our first customer segmentation example, we’ll look at Baremetrics’ actual Monthly Recurring Revenue (MRR), a metric that shows your recurring revenue normalized into a monthly amount.
Baremetrics is a medium-sized SaaS company.
- The bulk of our customers subscribe to small plans priced at under $200 per month.
- Only around 25% of their customers pay for the premium plans priced at $200 per month and above.
Here is the graph of our average MRR.
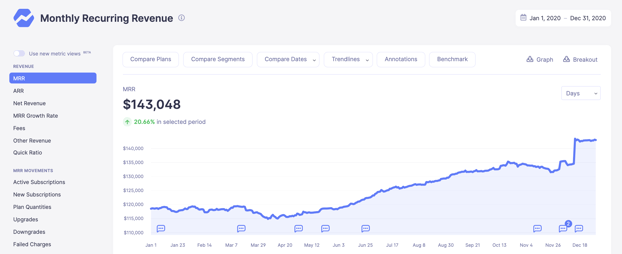
This graph shows a 20% increase in MRR over the course of one year. But, the problem with analyzing growth based on this data alone is that the MRR shown is an aggregate for all plans.
In other words, it averages MRR across all plans that this company offers. If some products are doing much better than others, this aggregate data won’t immediately reveal it.
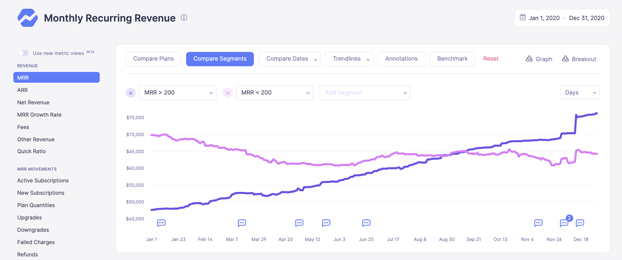
Here is MRR again, but broken down into two segments:
- Customers with plans that cost less than $200
- Customers with plans that cost more than $200
Keeping in mind that Baremetrics charges customers based on their MRR, this second graph shows that Baremetrics makes more of its MRR from larger companies.
What actions could we take based on this data? Our options include:
- Discontinue sales of smaller plans and focus on selling to larger companies
- Allocate resources to the customer success team so they can sell account upgrades to increase plan prices
Additional customer segmentation by geographical region or client type can also reveal sections of the market that are receptive to the product, but have as of yet remained largely untapped by that business.
Based on this data, sales and R&D resources reallocated from the low-tier subscriptions can now target this new customer base with a high chance of success. The information gleaned by segmenting MRR metrics in this way provides a reliable roadmap to growth.
2. Revenue Churn by Product Use
For the next example, we’ll look at what segmentation tells us about customer churn patterns.
Here are some empirical observations we’ve recorded:
- Average churn rate is 4.3%, which is below industry average of 5%
- Customers on a lower tier subscription churn much more frequently than customers on a higher tier
- Churn rate is highest around the three month mark
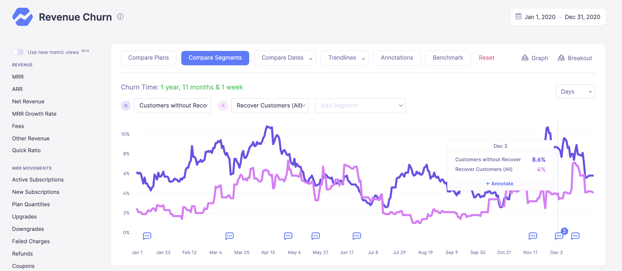
Here’s the aggregate revenue churn at 4.3%.
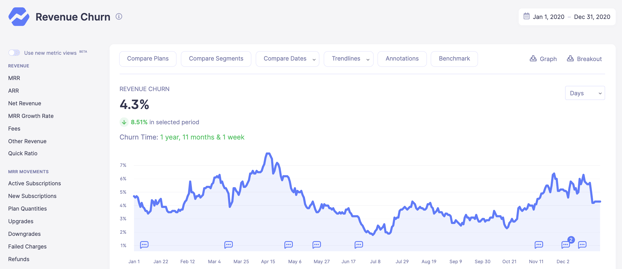
From here, what we need to know is: why are our customers churning?
To start, we decided to take a deep dive into our own data to find out who is churning.
If we could find a correlation between the customers cancelling their subscriptions, we could potentially adapt our product to offer them something worth staying for.
To do this, we created a segment that compared customers using our Recover tool with customers who aren’t.
Before we dive in, let me briefly explain what Recover does, and why it’s such a useful tool for subscription-based companies.
Recover is an automated dunning solution that helps teams earn back revenue lost due to failed payments. Failed payments are a huge issue for SaaS and subscription businesses because the subscription model involves charging customers on a regular, usually monthly, basis.
Recover completely automates the dunning process so neither you nor your customers have to worry about losing money for preventable reasons. It works by automating customizable email campaigns, in-app reminders and paywalls, credit card capture forms, and in-depth analytics.
As we were diving into churn patterns, we noticed something else. There was a really high incidence of customers churning at the 3 month mark.
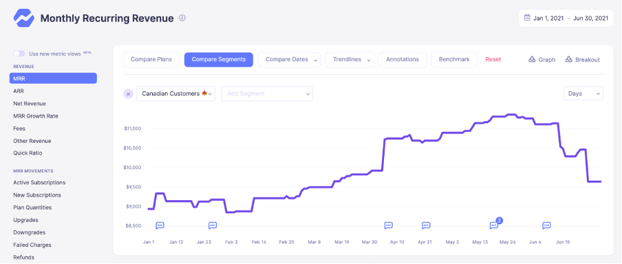
Here is a graph showing MRR from our Canadian customers. As a test, in April we offered a three month package subscription plan. You can see the graph spike in early April. Three months later, these subscriptions ran out and were not renewed, as seen by the drop in early July.
What this told us was that customers who purchased a three month long subscription were unlikely to renew. The most likely explanation is that the majority of these customers were start-ups and smaller companies, who were looking for short term insights but were unable or unwilling to invest in monitoring their metrics longer term.
We weren’t making much revenue off these three month plans, so we decided to scrap them.
Instead, we’d offer a minimum subscription for six months. Even if we only got half the customers, we’d have the same revenue, with fewer sign-up and cancellation costs on our end.
Many of the businesses who opted for the three month minimum subscription would in fact sign up for the six month period, as they still required insights into their metrics and simply wanted the cheapest of our provided options to do so.
For us as a business it was an important insight to know that our product, even when used as a one-off, was worth double its original pricing to many of our customers.
3. Upgrades by Customer Type
For our last example, let’s look at what customer segmentation can tell us about account upgrades.
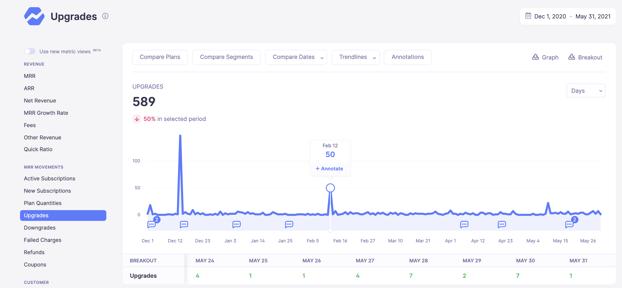
The graph below tracks the quantity of customer upgrades over a six month period. Between February 5 and 16, we saw a spike of 50 upgrades. We want to know which customers are most likely to do this.
Other than showing that two days in particular triggered a high number of upgrades, this aggregate data doesn’t reveal much about the customers prone to move to a higher tier plan.
We then decided to drill down into the upgrade metric by segment in order to gain insights on its customer behaviour, as seen in the following graph.
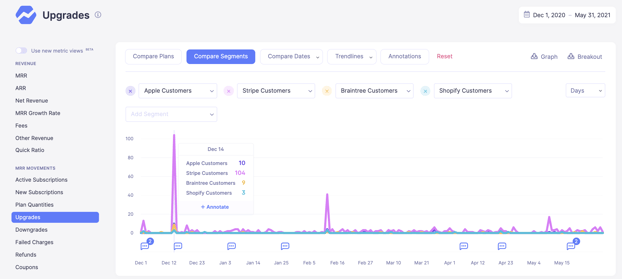
Segmenting customers by type reveals that Stripe customers are vastly more likely to upgrade than Shopify, Braintree or Apple users.
With this data, we can now decide whether to mainly target Stripe customers, or to invest in better cross-platform compatibility for Apple, Braintree and Shopify users to make their own service more attractive to these types of consumers.
Using Baremetrics for Customer Segmentation
Customer segmentation usually involves taking a single qualifying piece of information and showing data for that subset. The onus falls on the user to try and extract meaningful insights within that data.
In Baremetrics, you can segment users by demographic traits and behavior, gaining insight into key metrics for each segment There is enormous flexibility in how to mine your data to suit your business needs, whether you want to analyze churn by feature, MRR by geography, LTV by plan, just as a few examples.
You can see how to start with customer segmentation on Baremetrics.
Without the option to segment customer data, key metrics are presented merely in averages, and cannot provide the crucial insights needed to plan your next steps.
This doesn’t give you useful information when you want to improve your marketing campaigns, deliver personalized sales offers, or improve the user experience to boost retention.
Baremetrics allows you to get granular about your segmentation without requiring advanced numeracy or statistical analysis training. Our customer segmentation dashboard is easy to use and understand.
Tired of wasting time on spreadsheets? Get a free trial of Baremetrics today!