Table of Contents

Want to predict your SaaS revenue growth? Here’s the quick answer: Use Cohort-Based Forecasting, the MRR Buildup Model, or Driver-Based Forecasting to estimate Monthly Recurring Revenue (MRR) trends. Each method fits different business stages and goals.
- Cohort-Based Forecasting: Groups customers by signup date to track retention, churn, and expansion trends. Best for mid-stage SaaS businesses ($10K–$100K MRR). Accuracy: 75-95% for 3-6 month forecasts.
- MRR Buildup Model: Focuses on new, expansion, churn, and contraction MRR components. Ideal for early-stage companies ($5K–$50K MRR). Accuracy: 60-80% for 1-3 month forecasts.
- Driver-Based Forecasting: Links operational metrics (e.g., churn, conversion rates) to revenue outcomes. Suited for scaleups ($50K+ MRR). Accuracy: Up to 95% with AI tools.
Key takeaway: Choose a method based on your MRR size and data history, or combine approaches for better accuracy. Tools like Baremetrics can automate data collection and improve projections.
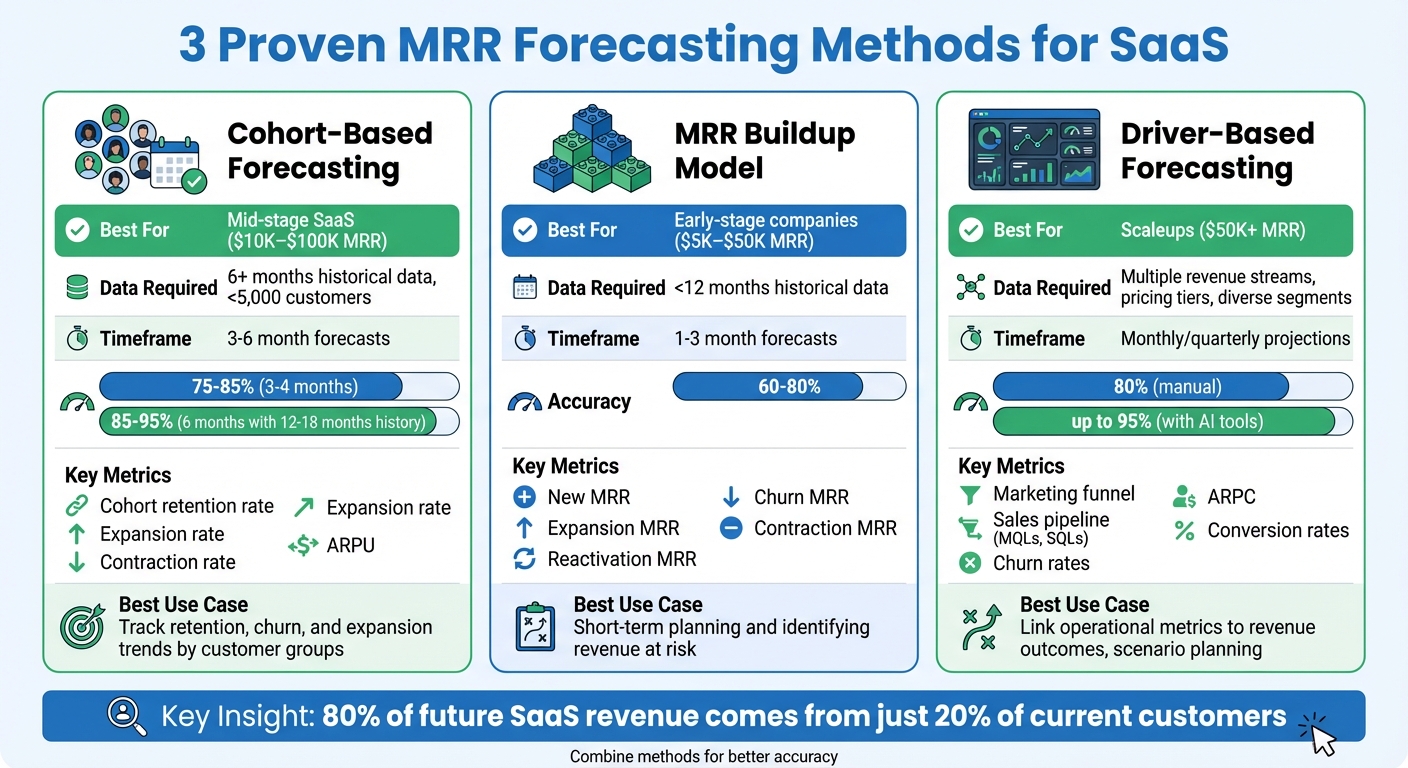
Comparison of 3 MRR Forecasting Methods for SaaS Businesses
How I Forecast SaaS Revenue (My Exact Model & Process After 1,000+ Forecasts) | The SaaS CFO
sbb-itb-18a9912
1. Cohort-Based Forecasting
Cohort-based forecasting organizes customers into groups based on shared characteristics - most often their signup date - and tracks how each group behaves over time. Instead of analyzing all customers as one large group, this approach focuses on specific cohorts to examine retention rates, expansion revenue, and churn patterns. For example, a January 2025 cohort might retain 93% of its MRR in the first month, drop to 86% in the second month, and further decline to 79% in the third month. This method provides a more precise revenue projection than aggregate models.
This approach can uncover patterns hidden in overall data. For instance, customers acquired through Product Hunt may have a 60% churn rate in the first month, while organic signups might only churn at 10%. By segmenting customers based on acquisition channel, plan type, or behavior, you can identify these differences and refine your forecasts. Notably, research highlights that 80% of future SaaS revenue comes from just 20% of current customers, making it crucial to pinpoint which cohorts deliver the most long-term value.
Business Suitability Based on MRR Size
Cohort-based forecasting is particularly effective for businesses with $10,000 to $100,000 in monthly MRR and at least six months of historical data. If your MRR is below $10,000, you likely lack sufficient customers or data points to make this analysis meaningful. On the other hand, companies with over $1 million MRR often benefit more from advanced, machine learning-driven models. The ideal candidates for this method are mid-stage SaaS companies with fewer than 5,000 customers.
Accuracy Range for Forecasting
With stable historical data, cohort-based forecasting offers 75-85% accuracy for 3-4 month projections. For businesses with 12-18 months of cohort history, accuracy can climb to 85-95% for 6-month forecasts. However, forecasts beyond 12 months tend to drop in accuracy, falling to 70-80%. To improve accuracy, it's recommended to use 3-6 month trailing averages to account for seasonal trends and integrate cohort data with your sales pipeline, which can push accuracy above 90%.
Key Metrics or Tools Required
To begin, you'll need detailed customer-level data, including signup dates, plan changes, churn dates, and at least 3-6 months of history. Focus on tracking these key metrics:
- Cohort retention rate: The percentage of MRR retained by each group over time.
- Expansion rate: Revenue growth from upsells.
- Contraction rate: Revenue losses from downgrades.
- ARPU (Average Revenue Per User): Measured for each cohort.
Tools like Baremetrics simplify this process by pulling data directly from payment platforms like Stripe, enabling real-time cohort tracking and revenue projections without the hassle of manual spreadsheets. While building a cohort model manually might take 3-4 hours, automated tools provide daily updates and eliminate the typical 15-30 day delays associated with Excel-based tracking.
This method not only provides valuable insights into customer behavior but also sets the stage for more advanced forecasting models, such as the MRR Buildup Model.
2. MRR Buildup Model
The MRR Buildup Model helps forecast revenue by starting with your baseline MRR and then adjusting it by factoring in specific MRR components. These include New MRR from new customers, Expansion MRR from upgrades, and Reactivation MRR from returning customers. On the flip side, it subtracts Churn MRR from cancellations and Contraction MRR from downgrades.
This model stands out as a tool for short-term planning. It’s particularly useful for identifying revenue at risk and setting a clear revenue floor to cover fixed expenses. In healthy SaaS businesses, Expansion MRR often accounts for 20–40% of growth, making it a crucial metric to monitor.
Business Suitability Based on MRR Size
This model works best for early to mid-stage SaaS companies with predictable subscription patterns and $5,000–$50,000 MRR. It’s especially helpful when historical data is limited (less than 12 months). If your business has less than $5,000 MRR, simpler linear growth projections might suffice. On the other hand, businesses exceeding $50,000 MRR often shift to more complex models - like driver-based or cohort models - to handle the added complexity. The buildup model is flexible; you can start with a simple spreadsheet and later upgrade to automated tools as your customer base and pricing structures grow.
Timeframe for Reliable Projections
The MRR Buildup Model is most accurate for 1–2 months and can provide reliable forecasts for up to 3 months. However, accuracy tends to decline beyond this window due to factors like seasonality and market changes that the model doesn’t account for. To mitigate this, it’s a good idea to run scenario analyses, looking at conservative, expected, and optimistic cases instead of relying on a single forecast.
Accuracy Range for Forecasting
For forecasts spanning 1–3 months, the model typically offers an accuracy range of 60–80%, depending on data quality and the maturity of your business. This accuracy falls between basic linear models and more advanced cohort-based approaches. The model uses historical trends but doesn’t dive into detailed behavioral analysis. Companies that incorporate churn-adjusted buildup models often achieve better accuracy compared to static spreadsheets. Tools like Baremetrics streamline the process by pulling real-time data from payment platforms like Stripe, minimizing manual errors and keeping forecasts up to date.
Key Metrics or Tools Required
To effectively use the MRR Buildup Model, you’ll need access to detailed financial records like profit and loss statements, balance sheets, and cash flow statements. It’s essential to track each MRR component - New, Expansion, Reactivation, Contraction, and Churn - individually. Using 3–6 month moving averages for growth rates can also provide a clearer picture of recent performance trends compared to fixed percentages.
Matt Smith, COO and Founder at Later, shared: "The insights provided by having accurate financials and forecasts at our fingertips gives us a competitive advantage, not to mention peace of mind".
3. Driver-Based Forecasting
Driver-Based Forecasting takes a different approach by focusing on the specific activities and decisions that directly influence revenue, rather than relying solely on historical trends. Instead of simply extending past MRR (Monthly Recurring Revenue) patterns, this method zeroes in on variables you can control - like marketing budgets, sales team size, trial-to-paid conversion rates, and customer success efforts. By connecting these operational drivers to revenue outcomes, it becomes easier to see how day-to-day decisions impact growth.
What sets this method apart is how it assigns responsibility to specific teams. For example, sales teams take ownership of close rates, customer success teams focus on churn metrics, and product teams are accountable for usage patterns and expansion opportunities. This structure also allows for "sensitivity checks", letting you model scenarios like the effect of a 1% increase in churn or a slowdown in upsells for a quarter. This makes it a practical tool for tying operational decisions directly to financial outcomes, complementing the advanced forecasting techniques discussed earlier.
Business Suitability Based on MRR Size
Driver-based forecasting is particularly suited for scaleups and mature SaaS companies, where complexity often outpaces the capabilities of simpler models. As businesses grow and introduce multiple revenue streams, pricing tiers, and diverse customer segments, basic forecasting methods often fall short. For late-stage companies, this model can also help maintain the Rule of 40, which combines revenue growth rate and profit margin to determine whether growth or profitability should take priority.
Timeframe for Reliable Projections
In most SaaS businesses, monthly or quarterly projections work best with driver-based forecasting. Since factors like churn and upgrades can shift quickly, frequent updates ensure the model stays relevant. The goal here is speed over perfection - aiming for around 80% directional accuracy allows for faster decision-making.
Accuracy Range for Forecasting
Compared to cohort or buildup models, driver-based forecasting provides quicker, actionable insights, especially when enhanced with AI tools. Manual models typically achieve around 80% accuracy, which is often sufficient for timely decisions. However, spreadsheets are prone to errors - 94% of them, in fact, contain inaccuracies that can distort forecasts. AI-driven tools can boost accuracy to 95% by factoring in real-time data like deal age or stakeholder engagement. Platforms like Baremetrics Forecast+ simplify this process by integrating with tools like Stripe, QuickBooks Online, and Xero, automating data collection and minimizing errors while focusing on key SaaS metrics like MRR, churn, and ARPC (Average Revenue Per Customer).
Key Metrics or Tools Required
To make driver-based forecasting work, you’ll need to track metrics across several areas:
- Marketing Funnel: Website visitors, signup rates
- Sales Pipeline: MQLs (Marketing Qualified Leads), SQLs (Sales Qualified Leads), trial-to-paid conversion rates
- Customer Success: Churn rates, reactivations
- Product/Pricing: Expansion, contraction, ARPC
For the best outcomes, combine driver-based forecasting with other methods like cohort analysis for churn and pipeline-based forecasting for new business. This hybrid approach captures a broader range of revenue behaviors and ensures a more comprehensive view of performance.
How to Apply These Forecasting Methods
Bringing these forecasting methods into your SaaS strategy is essential for creating accurate and actionable projections. To streamline the process, combine these techniques with real-time data and automation. Relying on manual spreadsheets can lead to errors that skew your forecasts. Instead, tools like Baremetrics simplify the process by automating live data collection from payment platforms like Stripe, QuickBooks Online, and Xero.
For cohort-based forecasting, Baremetrics’ Cohort Analysis feature organizes customers by their sign-up date. This approach helps track retention rates, customer lifetime value, and expansion trends over time. By analyzing churn as a "retention event" (based on historical cohort behavior and usage patterns) rather than a "sales event", you gain a more precise understanding of customer behavior. To ensure consistent monthly recurring revenue (MRR) across months, standardize billing cycles by dividing annual payments by 12. This consistency improves the accuracy of your forecasts. By applying these principles, you can seamlessly transition to using them in the MRR buildup model.
When working on an MRR buildup model, Baremetrics Forecast+ offers several forecasting options tailored to your business needs. You can choose the "Fixed Average" method to base projections on historical data or go with the "Trailing Average" to account for recent trends. For businesses experiencing steady growth, the "Average + Growth" method allows you to apply specific growth rates to historical averages, simulating linear growth. Additionally, manual overrides let you adjust for one-time events like unexpected expenses or large deals. With automated refinements to your MRR buildup, you can focus on managing key drivers for deeper insights.
"Forecast+ has been instrumental to growing our company in a capital efficient manner. The insights provided by having accurate financials and forecasts at our fingertips gives us a competitive advantage, not to mention peace of mind." - Matt Smith, COO and Founder, Later
For driver-based forecasting, actionable insights come from directly linking business decisions to revenue outcomes. Baremetrics enables you to monitor critical metrics - such as marketing funnel performance, trial-to-paid conversion rates, and churn - across different customer segments. This ensures each metric contributes to improving revenue accuracy and scalability. The Forecast+ hiring planning tool helps you estimate the financial impact of new hires, including raises, payroll taxes, and benefits. You can also project variable expenses, like Cost of Goods Sold (COGS), as a percentage of revenue, allowing expense forecasts to scale with growth. If specific changes are planned, such as a boost in advertising spend, manual overrides let you adjust individual drivers without disrupting the rest of your automated model.
Conclusion
Selecting the best forecasting method depends on your business's current stage and revenue. For early-stage companies with less than $5,000 in Monthly Recurring Revenue (MRR), the MRR Buildup Model is ideal. It’s straightforward and uses basic churn and expansion data to create projections. Mid-sized businesses with $10,000–$100,000 in MRR and at least six months of customer data can benefit from Cohort-Based Forecasting, which highlights retention trends and growth opportunities across different customer segments. For companies generating $50,000+ in MRR, Driver-Based Forecasting allows for scenario planning by linking key metrics like Average Revenue Per User (ARPU), customer count, and retention rates.
Combining methods can further improve accuracy. For example, pairing cohort analysis with an MRR buildup model provides deeper insights, especially when you incorporate behavioral data and usage trends instead of viewing churn as a one-time event. To refine your forecasts, build three scenarios - conservative, expected, and optimistic - and compare them monthly against actual results to fine-tune your approach.
Baremetrics simplifies the entire process with its real-time dashboards, automated cohort analysis, and revenue forecasting tools. By integrating directly with platforms like Stripe and QuickBooks, it eliminates spreadsheet errors and ensures accurate predictions.
"In just one week, Baremetrics helped us grow MRR by 15% through simple insights into our pricing plans. It's becoming our #1 tool for optimizing our SaaS business." - Max Lynch
FAQs
How do I choose the right MRR forecasting method for my stage?
Choosing the right method for MRR forecasting largely depends on where your business stands and how much data you have. If you're running an early-stage SaaS company, simpler approaches like Average or Average + Growth are solid options - they're easy to use and work well when data is limited. As your business expands and you gather more data, you can move to advanced methods like Manual adjustments or % of Revenue to improve precision. The key is to start with the basics and gradually incorporate more detailed techniques as your needs and data grow.
What data do I need before cohort-based forecasting works?
To make cohort-based forecasting work well, you’ll need a few critical pieces of information: historical subscription data, insights into customer behavior, and revenue metrics. These data points are essential for spotting trends and predicting future growth with precision.
Can I combine these methods without double-counting revenue?
To combine these methods without accidentally double-counting revenue, it's important to clearly segment and track key components such as new MRR (Monthly Recurring Revenue), expansion, contraction, and churn. Make sure each of these elements is separately accounted for in your forecasting process to keep your projections accurate and reliable.