Table of Contents
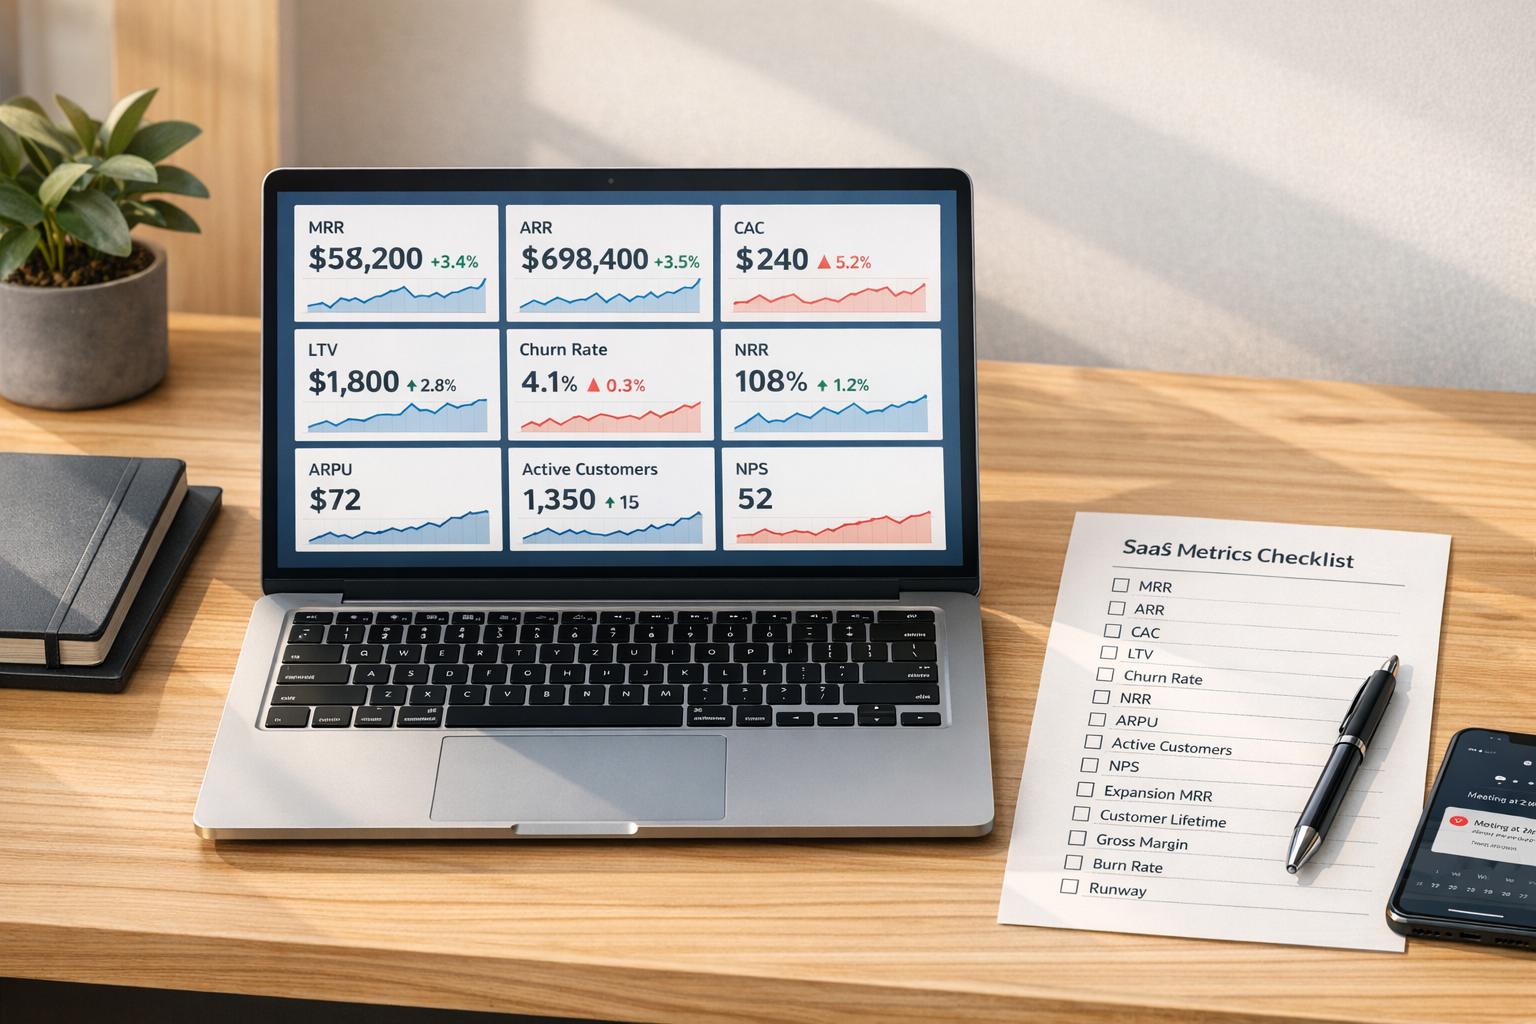
Running a SaaS business without tracking the right metrics is like flying blind. To build a scalable and profitable company, focus on these 15 key performance indicators (KPIs). Here's a quick overview:
- Revenue Metrics: Monitor Monthly Recurring Revenue (MRR), Annual Recurring Revenue (ARR), and Average Revenue Per User (ARPU) to understand income trends.
- Customer Acquisition: Track Customer Acquisition Cost (CAC), CAC Payback Period, and Lead Velocity Rate (LVR) to measure how effectively you're acquiring customers.
- Retention Metrics: Keep an eye on Churn Rate, Net Retention Rate (NRR), and Customer Lifetime Value (LTV) to ensure customers stick around.
- Efficiency Benchmarks: Use the LTV:CAC ratio and conversion rates to balance growth and profitability.
- Satisfaction Indicators: Net Promoter Score (NPS) highlights customer loyalty and satisfaction.
Tracking these KPIs helps SaaS founders make data-driven decisions, avoid pitfalls like high churn, and allocate resources effectively. Dive deeper into each metric to understand how they impact your business's health and growth potential.
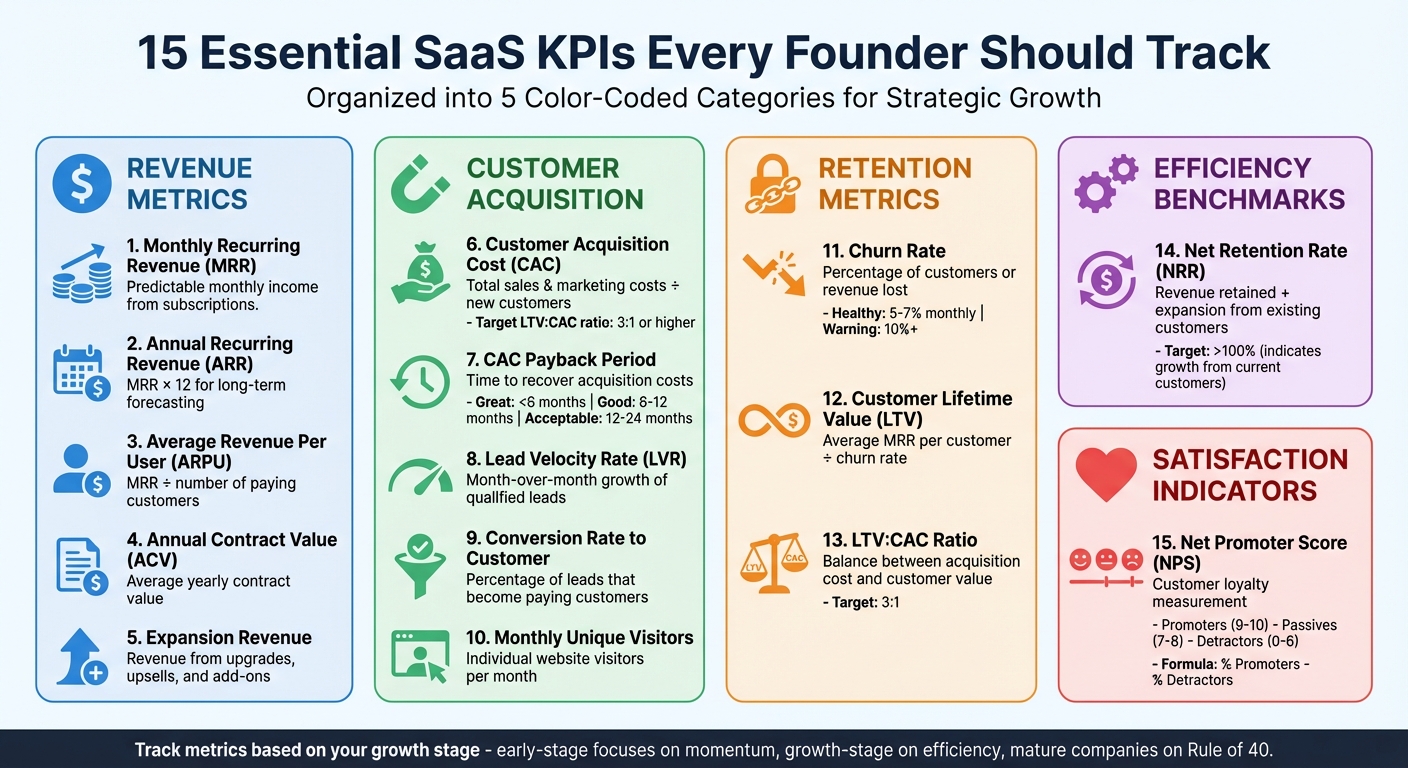
15 Essential SaaS KPIs Every Founder Should Track
SaaS Metrics - The BEST Guide to Software as a Service KPIs
Revenue & Growth Metrics
Revenue metrics are the pulse of your SaaS business. They show whether your income streams are steady and help you identify growth opportunities - or potential problems - early on. Starting with these metrics gives you a clear picture of your financial health and growth potential.
Monthly Recurring Revenue (MRR)
MRR represents the predictable income your business generates monthly from active subscriptions. Think of it as your financial baseline - the amount you can count on next month without adding any new customers. Joel Gascoigne, CEO of Buffer, sums it up well:
"I'm always looking at MRR. At the end of the day, that's our revenue and drives a lot of other strategic decisions such as hiring and other spend".
To calculate MRR, exclude one-time fees and normalize annual contracts by dividing their total value by 12. This approach ensures your revenue tracking reflects consistent, recurring income.
Tracking net MRR - after accounting for refunds, failed payments, and chargebacks - provides a more accurate view of the funds actually hitting your bank account. The 2024 OpenView Benchmarking Report highlights that SaaS companies with less than $1M ARR aim for 90% year-over-year growth, while those between $1M–$5M ARR target 58%.
Here’s a breakdown of MRR components and their impact:
| MRR Component | Description | Impact on Growth |
|---|---|---|
| New MRR | Revenue from new customers acquired during the month | Drives top-line growth |
| Expansion MRR | Revenue from upgrades or add-ons by existing customers | Boosts revenue without extra acquisition costs |
| Reactivation MRR | Revenue from churned customers who return | Reflects long-term product value |
| Contraction MRR | Revenue lost when customers downgrade | Points to potential pricing or value issues |
| Churn MRR | Revenue lost due to cancellations | Highlights sustainability challenges |
Annual Recurring Revenue (ARR)
ARR offers a long-term perspective on your revenue trends. You calculate it by multiplying your MRR by 12. This metric is especially helpful for forecasting and communicating progress to investors, as it smooths out seasonal or one-off revenue fluctuations. ARR is also a key tool for strategic planning, whether you're setting annual goals or evaluating whether to grow your team.
Average Revenue Per User (ARPU)
ARPU measures how much revenue each paying customer contributes on average. To calculate it, divide your MRR by the number of active, paying customers. For accuracy, exclude free trials and delinquent accounts.
For example, in 2023, Spotify reported annual revenue of €13.24 billion with an ARPU of €4.27, showcasing a high-volume, low-ARPU model. Higher ARPU, on the other hand, means fewer customers are needed to hit revenue targets. Segment ARPU by factors like geography or subscription tier to find your most profitable customer groups. A declining ARPU might signal pricing challenges, while an increase suggests customers are upgrading or finding more value in your offerings.
Annual Contract Value (ACV)
ACV reflects the average value of a customer contract over a year, making it crucial for sales planning and forecasting - especially for enterprise SaaS businesses with longer-term deals. To calculate ACV, divide the total contract value by the number of years and average it across all contracts. This metric helps you set realistic sales goals and determine how many deals your team needs to close each quarter to meet revenue targets.
Expansion Revenue
Expansion revenue comes from existing customers through upgrades, upsells, cross-sells, or add-ons. It's one of the most efficient ways to grow because it doesn’t require new customer acquisition costs. Nick Franklin, Founder & CEO of ChartMogul, highlights its importance:
"Retention is a primary growth driver from day one".
Baremetrics has shared that their expansion MRR - fueled by add-ons and upgrades - often surpasses revenue from new customer acquisitions. When your expansion revenue outweighs churn, you achieve negative churn, meaning your business grows even without acquiring new customers.
To maximize expansion revenue, bake it into your strategy early on. For instance, seat-based pricing can increase revenue as your customers' teams grow. Add-on products let customers tailor subscriptions to their needs, boosting satisfaction and revenue. Keep an eye on which features drive upgrades to fine-tune your pricing and product development. These insights help you balance the cost of acquiring customers with the value they bring over time.
Customer Acquisition Metrics
Knowing how much you spend to bring in new customers - and how efficiently you convert them - can make or break your growth strategy. These metrics help you pinpoint which channels are worth investing in and which ones are draining your budget.
Customer Acquisition Cost (CAC)
Customer Acquisition Cost (CAC) tells you how much it costs, on average, to acquire a single new customer. It includes all sales and marketing expenses, such as ad spend, salaries, commissions, benefits, software tools, agency fees, and creative development. To calculate it, divide the total sales and marketing costs by the number of new customers acquired in a specific period. For example, if you spent $50,000 in January on these efforts and brought in 100 customers, your CAC would be $500.
Bobby Pinero, Co-founder of Equals, sums up its importance:
"CAC is a tactical tool to allocate marketing budgets, highlighting the cost efficiency of acquiring new customers across channels and campaigns."
Breaking CAC down by channel and customer type can reveal where your money is well spent. For instance, a $200 CAC from organic content marketing tells a very different story compared to a $2,000 CAC from paid ads, even if the overall average looks fine.
What to exclude: Don’t count Customer Success costs aimed at retaining existing customers or R&D expenses. For products with long sales cycles, like enterprise software, allocate earlier sales and marketing spend to the customers who eventually convert.
You can also calculate marginal CAC, which focuses on variable costs like ad spend and commissions, leaving out fixed overheads. This version is especially helpful for optimizing specific channels.
For SaaS companies, a healthy LTV to CAC ratio is generally 3:1 or higher. Hunter Dickinson, Head of Strategy at Whop, explains:
"If the CAC is high but the CLV is also high, it may make sense to continue investing in sales and marketing efforts to acquire new customers."
Interestingly, a ratio of 5:1 or higher might mean you’re not spending enough on growth. If you’re recovering costs too quickly, you could be missing out on potential revenue by not scaling faster.
To lower CAC, focus on organic growth strategies like SEO, content marketing, and referrals. Streamlining your sales process and automating lead nurturing can also help you convert more leads without increasing costs.
CAC Payback Period
Once you’ve calculated your CAC, the next step is figuring out how quickly you recover it. This is your CAC Payback Period, which tells you how many months it takes to recoup the cost of acquiring a customer. For B2B SaaS companies, a payback period of 6 to 12 months is considered solid. High-performing companies often hit the 5 to 7-month range, while anything under 6 months signals a highly scalable business. On the flip side, payback periods over 24 months can strain cash flow and may require rethinking your pricing or business model.
Bobby Pinero highlights why this matters:
"A shorter Payback Period improves cash flow, freeing up capital for reinvestment back into the growth of the business. This is crucial because cash runway is the lifeblood of any startup."
To calculate this, divide your CAC by your Average Revenue Per Account (ARPA). For a more detailed view, divide CAC by monthly profit per customer, where profit equals revenue minus costs to serve.
You can shorten the payback period by offering annual upfront billing, which recovers costs immediately upon conversion. Simplifying onboarding with self-service tools and tutorials can also help customers find value faster. Additionally, upselling and cross-selling can boost monthly profits, reducing the time it takes to break even.
| Payback Period | Performance Rating |
|---|---|
| < 6 Months | Great (Highly scalable) |
| 6-12 Months | Good (Healthy balance) |
| 12-24 Months | Acceptable (Room for improvement) |
| 24+ Months | Challenging (Sustainability risk) |
Lead Velocity Rate (LVR)
Lead Velocity Rate (LVR) measures the month-over-month growth of qualified leads, giving you a peek into future revenue potential. For example, if your qualified leads grew by 15% this month, it’s reasonable to expect revenue to follow a similar path in the coming months.
This metric is a reality check for your marketing and demand generation efforts. A declining LVR suggests trouble ahead, even if your current Monthly Recurring Revenue (MRR) looks strong. On the other hand, a rising LVR shows your pipeline is growing, which can justify ramping up sales investments.
When tracking LVR, focus only on qualified leads - those who fit your ideal customer profile and show genuine buying intent. Raw lead volume won’t tell you much if those leads aren’t high quality.
Conversion Rate to Customer
While LVR looks ahead, conversion rates reveal how well you’re turning leads into paying customers. This metric shows the percentage of leads that convert. For example, if 1,000 leads enter your funnel and 50 become customers, your conversion rate is 5%. Low conversion rates could point to a mismatch between your marketing message and product, ineffective sales processes, or targeting the wrong audience.
Segment conversion rates by lead source to see which channels bring in the best prospects. For example, leads from content marketing might convert at 8%, while paid social leads convert at 2%. Even if paid social delivers more volume, content marketing may be the better investment.
Improving conversion rates helps lower CAC without cutting marketing spend. Small improvements add up: increasing your conversion rate from 5% to 6% means you acquire 20% more customers from the same number of leads.
Monthly Unique Visitors
Monthly unique visitors measure how many individual people visit your website each month. It’s a great way to gauge the effectiveness of your content, SEO, and marketing campaigns.
This metric works best when paired with conversion rates. High traffic with low conversions could mean your messaging or product-market fit needs work. Low traffic with high conversions suggests you need to focus on scaling your awareness efforts. Ideally, you want both traffic and conversions growing together - more visitors and better conversion efficiency.
Use visitor data to identify which content resonates most with your audience. A blog post that attracts 10,000 visitors but leads to zero conversions isn’t as valuable as one that brings in 500 visitors who convert at 10%.
sbb-itb-18a9912
Customer Retention & Satisfaction Metrics
Once you've nailed down acquisition costs, it's time to shift focus to customer retention. Why? Because keeping customers is far more cost-effective than acquiring new ones - estimates suggest it can be 5 to 25 times cheaper. Retention metrics are crucial for understanding how well you're holding onto customers, the value they're creating over time, and whether they're satisfied enough to stick around and grow with your business.
Churn Rate
Churn rate tracks how many customers or how much revenue you lose over a specific period. There are two key types: customer churn, which measures the percentage of users who cancel, and revenue churn, which calculates the percentage of recurring revenue lost due to cancellations or downgrades. For most SaaS companies, a healthy monthly churn rate falls between 5% and 7%. If you hit 10% or more, it's a sign of trouble with your product or business model.
Not all churn is the same. Involuntary churn occurs when payments fail due to issues like expired cards, while voluntary churn happens when customers actively cancel their subscriptions. The good news? Involuntary churn is often fixable. Advanced payment recovery systems, using tailored retry strategies for specific decline reasons, can recover 80% to 90% of failed payments.
Here’s how to calculate churn rates:
- Customer churn rate: Divide the number of customers who canceled in the past 30 days by the total number of active customers from 30 days ago, then multiply by 100.
- Revenue churn rate: Divide the monthly recurring revenue (MRR) lost due to cancellations or downgrades by the MRR from 30 days ago, then multiply by 100.
"When you're unable to keep your churn under control, it'll eat away at your revenue to the point where your business is unsustainable." - Baremetrics Academy
Reducing churn starts with understanding why customers leave. Use cancellation surveys to uncover reasons - are they dissatisfied with the product, pricing, or competition? Then take action. Improve onboarding, offer alternatives to cancellations, and leverage engagement data with predictive analytics to address issues before they escalate.
| Metric Type | Formula | Purpose |
|---|---|---|
| Customer Churn Rate | (# of canceled customers in last 30 days / Active customers 30 days ago) x 100 | Tracks the percentage of customers lost. |
| Revenue Churn Rate | (MRR lost to downgrades & cancellations in last 30 days / MRR 30 days ago) x 100 | Measures the percentage of revenue lost. |
Customer Lifetime Value (LTV)
To truly understand customer retention, you need to estimate their long-term value. Customer Lifetime Value (LTV) predicts the total revenue a customer will generate over their entire relationship with your business. This metric is crucial for determining how much you can spend on acquiring new customers. To calculate it, divide your average monthly MRR per customer by your churn rate. For instance, if your average customer pays $100 monthly and your churn rate is 5%, your LTV is $2,000.
LTV helps pinpoint which customer segments are the most profitable, allowing you to focus efforts on high-value groups. To stay profitable, your LTV should always exceed your customer acquisition cost (CAC).
"The LTV can help you to determine how much you should spend to acquire a new customer. Ideally, your LTV should be greater than your CAC." - Baremetrics Academy
Since LTV is based on historical data, it’s important to recalculate it regularly, especially when pricing, churn trends, or expansion revenue change. Breaking it down by marketing channel can reveal which sources bring in the most valuable customers - SEO leads, for example, might generate higher LTV than paid ad leads despite lower volume.
LTV:CAC Ratio
The LTV:CAC ratio shows the balance between what you spend to acquire a customer and the revenue they bring in over time. A ratio of 3:1 is the gold standard for SaaS businesses, meaning each customer should generate three times the cost of acquiring them. Ratios below this suggest you're overspending on acquisition relative to the value you’re gaining.
"A high LTV:CAC indicates that the business can invest in acquiring customers and ultimately be highly profitable from those efforts." - Bobby Pinero, Co-founder, Equals
To improve this ratio, work on increasing LTV by refining pricing strategies, accelerating time-to-value, and boosting expansion revenue through upsells. Simultaneously, reduce CAC by optimizing your sales funnel and focusing on channels that bring in high-quality leads. The LTV:CAC ratio serves as a reality check to avoid over-investing in low-quality leads that churn quickly.
Net Retention Rate (NRR)
Unlike churn, which only measures losses, Net Retention Rate (NRR) provides a complete picture by factoring in cancellations, downgrades, and revenue growth from upsells and cross-sells. It reflects how much revenue you're retaining and expanding within your existing customer base. To calculate NRR, divide retained revenue (including expansions) by your base recurring revenue, then multiply by 100.
An NRR above 100% means you’re growing revenue from your current customers even after accounting for churn - a strong indicator of a scalable business. If your NRR falls below 100%, it’s a sign that churn and downgrades are outpacing your growth efforts. A Quick Ratio of at least 4 is often used as a benchmark for NRR.
NRR is especially valuable because it highlights whether your product is delivering enough value to justify upsells and cross-sells. If your NRR is low, it’s time to improve your product, enhance customer success initiatives, or rethink your pricing strategy.
Net Promoter Score (NPS)
Net Promoter Score (NPS) gauges customer satisfaction and loyalty with one straightforward question: "On a scale of 0 to 10, how likely are you to recommend this product or service to a friend or colleague?" Based on their responses, customers are grouped into three categories:
- Promoters (9–10): Enthusiastic and loyal customers.
- Passives (7–8): Satisfied but not overly enthusiastic, and open to competitor offers.
- Detractors (0–6): Unhappy customers who may harm your brand with negative feedback.
Your NPS is calculated by subtracting the percentage of detractors from the percentage of promoters, ignoring passives. For instance, if 59% of respondents are promoters and 11% are detractors, your NPS is 48.
| Category | Score Range | Customer Sentiment | Impact on NPS Calculation |
|---|---|---|---|
| Promoters | 9–10 | Highly satisfied; loyal enthusiasts. | Added to the percentage. |
| Passives | 7–8 | Satisfied but unenthusiastic. | Ignored in the calculation. |
| Detractors | 0–6 | Unhappy customers; potential churn risk. | Subtracted from the percentage. |
While NPS doesn’t directly reflect revenue, it’s a strong predictor of future growth. High scores indicate potential for word-of-mouth marketing, while low scores signal dissatisfaction and possible churn. To get the most out of NPS, follow up with open-ended questions to understand the reasons behind customers’ scores. Use this feedback to address issues, improve the customer experience, and strengthen retention efforts. High NPS scores not only drive organic growth but also complement the retention strategies discussed earlier.
How to Track and Use SaaS Metrics
When it comes to tracking SaaS metrics, focus on what really matters for your business at its current stage. The priorities for a startup aiming to gain market share will look very different from those of an established company working to balance growth and profitability.
Here’s a breakdown of how to prioritize, organize, and put these metrics to work for meaningful growth.
Prioritize Metrics Based on Growth Stage
The metrics you prioritize should align with your company’s growth phase. For early-stage startups, it’s all about momentum. Metrics like trial sign-ups, monthly recurring revenue (MRR) growth rate, and lead velocity rate are key indicators of progress. If your early-stage company is already profitable, stability metrics like average revenue per user (ARPU) and customer retention rate take center stage.
As your company grows, focus shifts to efficiency. Growth-stage businesses need to track metrics like burn multiple, cash runway, and the customer lifetime value (CLTV) to customer acquisition cost (CAC) ratio. These numbers help you keep growth sustainable. For mature companies, it’s often about balancing growth with profitability. The Rule of 40 - a combination of your growth rate and profit margin adding up to at least 40% - becomes a critical benchmark.
By choosing the right metrics for your stage, you’ll be equipped to make quick, informed decisions that push your business forward.
Organize Metrics with Dashboards
Dashboards are a game-changer for turning scattered data into actionable insights. When metrics are centralized and interconnected, they tell a cohesive story. For instance, annual recurring revenue (ARR) shows your revenue flow, churn highlights what you’re losing, and the CAC-to-LTV ratio reveals whether your growth is financially sound.
Keep it simple: track only the metrics you actively manage. If you can’t clearly explain what action you’d take when a number falls short, it doesn’t belong on your dashboard. Use absolute numbers instead of percentages when visualizing growth, as they provide a clearer picture of performance. To maintain data accuracy, ensure every key performance indicator (KPI) has either an automated data feed or someone responsible for keeping it updated.
This organized approach ensures your analytics are always ready to guide your strategy.
Use Baremetrics for Unified Analytics
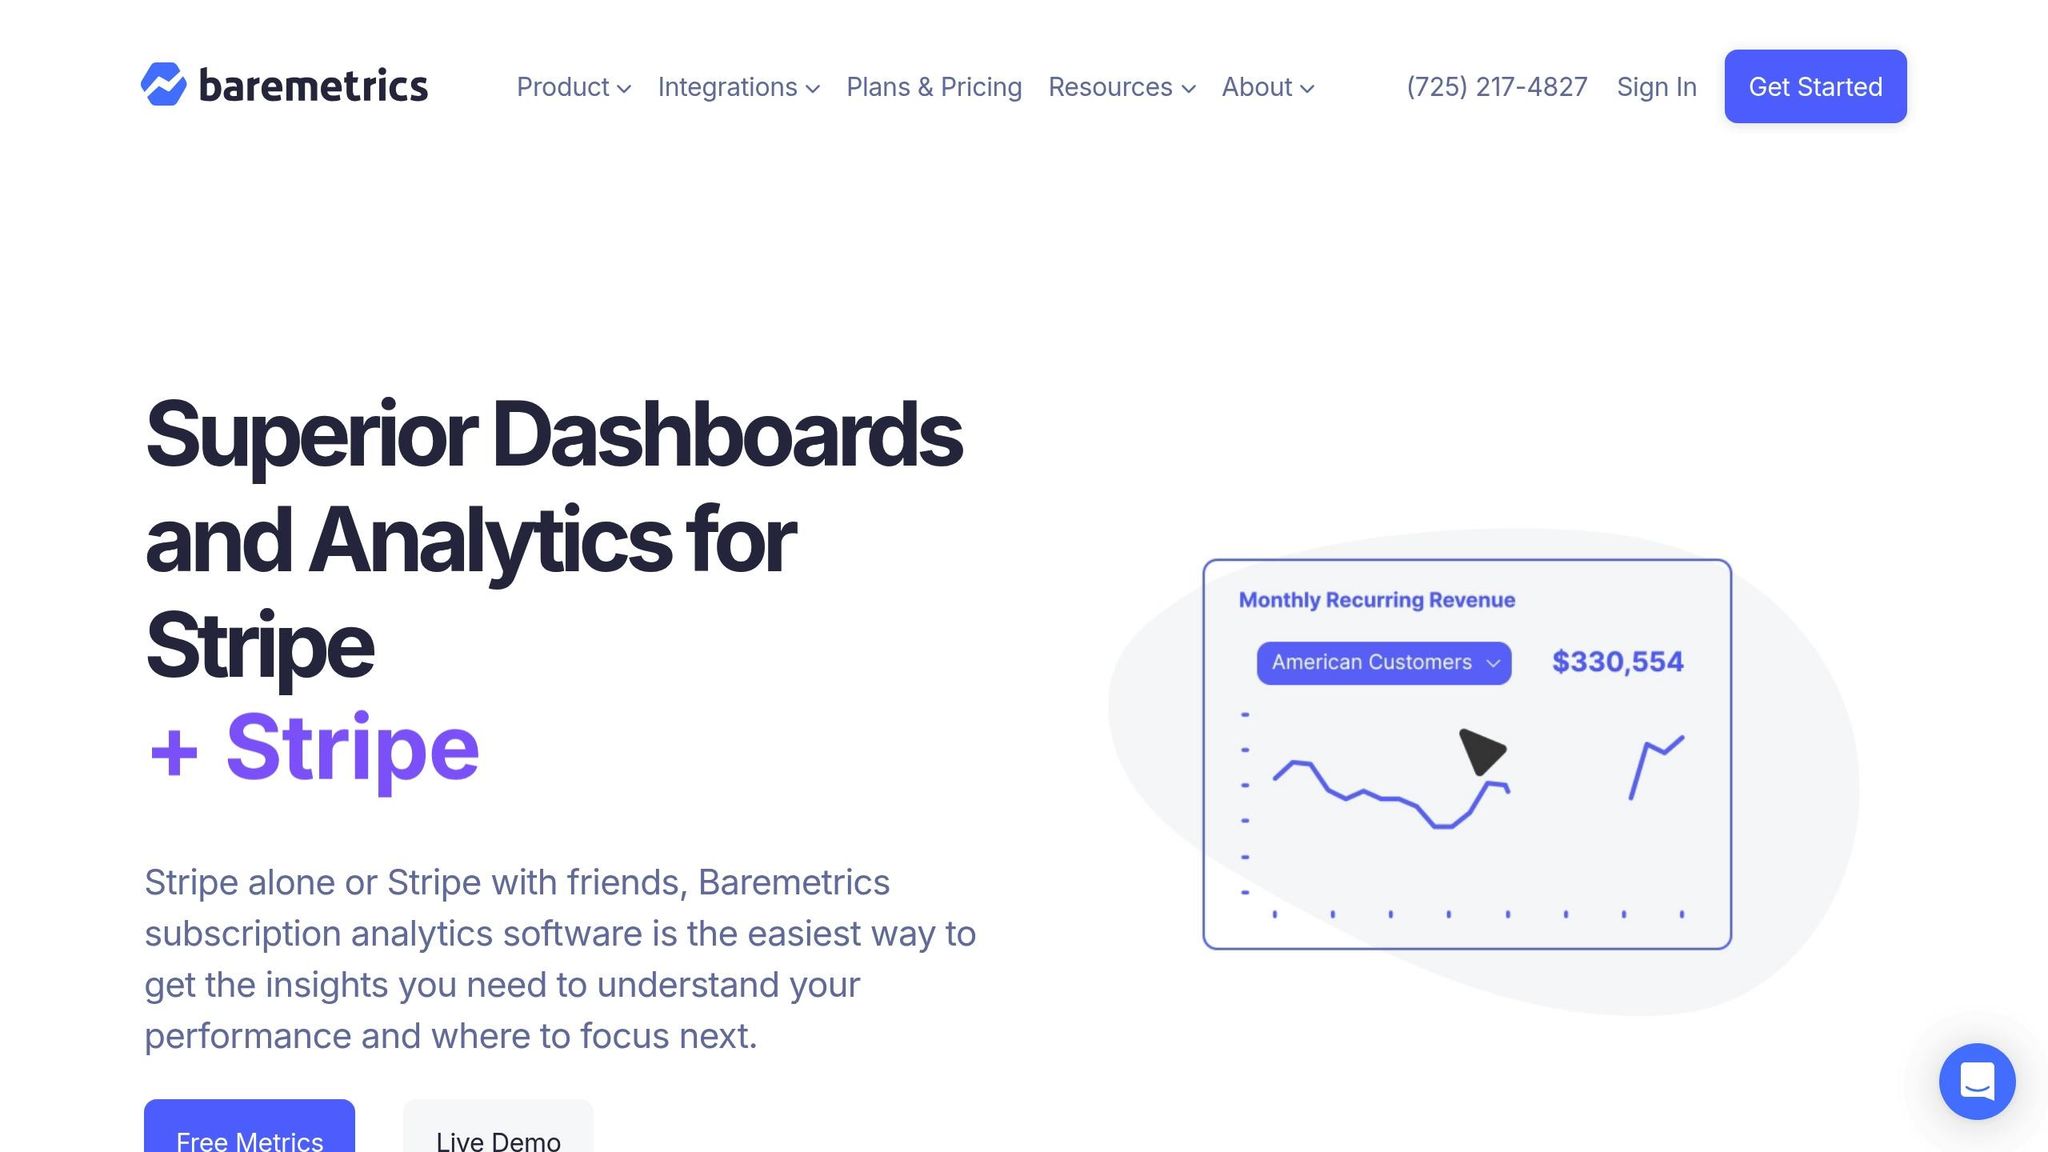
For an even smoother process, consider using Baremetrics for unified analytics. This platform consolidates data from payment processors and other platforms into a single, real-time dashboard, eliminating the need for manual tracking.
Baremetrics automatically calculates key metrics like MRR, churn, and LTV. It also offers features like automated dunning to recover missed payments, detailed insights into cancellations to understand why customers leave, and revenue forecasting to help you plan for the future. By automating these processes, Baremetrics lets you focus on growing your business instead of building and maintaining a custom analytics system.
With the right tools and a clear focus on relevant metrics, you can turn raw data into meaningful insights that drive growth.
Conclusion
Keeping an eye on the right KPIs helps you make smarter choices that directly impact your bottom line. The 15 metrics we've covered here give you a well-rounded view of your SaaS business - from how effectively you're bringing in new customers to how successfully you're retaining and growing revenue from your existing ones.
These KPIs, which cover everything from customer acquisition to retention, serve as a clear roadmap for growth. For example, the median SaaS company spends $2.00 on sales and marketing to generate just $1.00 of new annual recurring revenue, while companies in the top quartile boast Net Revenue Retention rates of 115-120%. These figures highlight the importance of balancing acquisition efforts with retention strategies. As Ricardo Rodriguez wisely notes:
"Your revenue isn't 'earned' until you've delivered value consistently over time".
It's also crucial to revisit your metrics regularly to stay in step with market changes. Acquisition costs, for instance, have jumped 14% in just one year, and customer behaviors are always shifting. What worked last year might not work today. Instead of trying to track every possible metric, zero in on the ones that align with your current growth phase. For instance, keeping your monthly churn rate below 7% is a solid indicator of a healthy business. Use these benchmarks as helpful guidelines, but remember - they're not one-size-fits-all rules.
FAQs
What are the key SaaS metrics every early-stage startup should focus on?
For early-stage SaaS startups, keeping an eye on the right metrics can make all the difference when it comes to tracking growth, retention, and profitability. Here are four key metrics that deserve your attention:
- Monthly Recurring Revenue (MRR): This metric reflects the steady, predictable revenue your business brings in each month. It’s a great way to measure financial health and stability over time.
- Churn Rate: This tells you what percentage of your customers are leaving. A high churn rate can signal issues with customer satisfaction or the product itself, making it an important area to address.
- Customer Acquisition Cost (CAC): Want to know how much you're spending to win a new customer? CAC helps you figure out if your marketing and sales strategies are cost-effective or need adjustments.
- Customer Lifetime Value (LTV): This is the total revenue you can expect from a customer throughout their relationship with your company. Comparing LTV to CAC can help you understand whether your customer relationships are profitable in the long run.
By tracking these metrics consistently, founders can make smarter, data-driven decisions to fuel growth and set the stage for a scalable business.
What are some effective ways to reduce Customer Acquisition Cost (CAC)?
Reducing your Customer Acquisition Cost (CAC) requires fine-tuning your marketing efforts to get the best return on investment. Start by zeroing in on the channels that consistently bring in high-quality leads and drive conversions without draining your budget. Use performance data to pinpoint where you can trim unnecessary spending while still maintaining strong results.
Another smart move is sharpening your customer targeting. Refine your customer personas to ensure your campaigns are hitting the right audience. This minimizes wasted ad spend on people who are unlikely to convert. Plus, focusing on customer retention can make a big difference - happy customers often lead to referrals and organic growth, which are far more budget-friendly ways to acquire new users.
Make it a habit to monitor your CAC metrics regularly. Keeping an eye on trends and identifying areas for improvement allows you to stay ahead and make data-backed decisions that help scale your SaaS business more efficiently.
What makes Net Retention Rate (NRR) a key metric for SaaS growth?
Net Retention Rate (NRR) is one of the most telling metrics for SaaS companies because it measures how effectively you're holding onto and growing revenue from your current customers. It combines the effects of customer renewals, upgrades, and downgrades, offering a clear snapshot of your recurring revenue's overall health.
When your NRR is strong, it signals that customers continue to see value in your product, leading to steady and predictable revenue growth. Prioritizing improvements in NRR can open doors to scaling your business more efficiently, all while lessening the pressure to constantly acquire new customers to fuel growth.