Table of Contents

Where does the benchmark data come from?
All of our benchmark data comes from Baremetrics, of course! Baremetrics is used by hundreds of subscription companies to monitor the health of their business and improve key metrics.
To create our Benchmarks, we completely anonymize and aggregate all our customer data into one large data set. This allows you to see how your company stacks up against other companies with similar Average Revenue Per User (ARPU) values.
We segment based on ARPU because it indicates how much a business charges per customer.

What metrics can you compare in Benchmarks?
Benchmarks includes benchmark data for:
- MRR
- Lifetime Value
- User Churn
- Revenue Churn
- Active Customers
- Quick Ratio
- Failed Charges Amount
- Failed Charges Percentage
It also includes a separate section dedicated to Pricing Insights, which analyzes your customer base and different subscription plans in order to give you insights on your pricing.
How to interpret benchmark information
Like the entire Baremetrics toolkit, Benchmarks was designed to make understanding your data information as simple and intuitive as possible. Let’s quickly walk through what you need to know.
To start, let’s look at the Monthly Recurring Revenue (MRR) benchmark. You’ll see MRR values for the lower, median, and upper quartiles, as well as how your company stacks up.
The value of Benchmarks is to not only compare your company’s metrics with others, but how you can improve, as well. To help you get started, each benchmark will provide tips for improvement.
For example, if you can see that your churn is high compared to others, start with reducing churn. Growing MRR is near impossible if any new revenue you add is lost to churn.
All the data your startup needs
Get deep insights into your company’s MRR, churn and other vital metrics for your SaaS business.
Understanding Pricing Insights
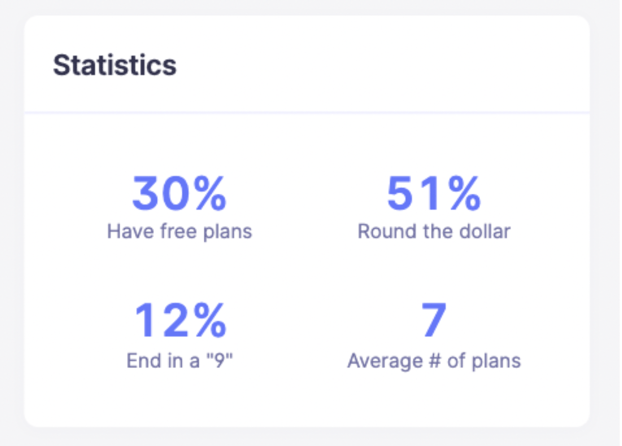
There are two main components of Pricing Insights: Statistics and Breakdown. If you’re wondering if your subscription pricing is right, or thinking about changing your pricing, this is a great place to start.
Under Statistics, you’ll see four figures. These figures pertain to the Baremetrics data set, as in, 30% of Baremetrics customers with $100 ARPU offer a free plan.
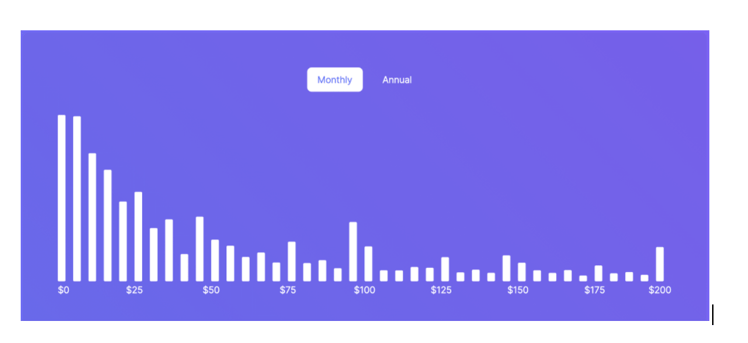
The Breakdown section shows the volume of different subscription plans within the Baremetrics customers with $100 ARPU. You can view both monthly and annual plans.

From a quick glance, we can see a few things:
- Free and very cheap plans have the highest number of monthly customers
- $99 plans are significantly more popular than $100 plans or other nearby values such as $90 or even $80.
- Baremetrics customers are selling plans at all different prices, and for different reasons. What works for the majority might not work for you!
Conclusion
Knowing how you stack up to other companies helps you set goals and know where you need to improve in order to reach them. When you use Baremetrics, the Benchmarks features makes it easy to track business metrics and analyze benchmark data.


