Table of Contents

Predictive analytics is transforming how SaaS businesses estimate and maximize customer revenue. Instead of relying on historical data alone, predictive customer lifetime value (CLV) uses advanced models to forecast future customer worth. This approach helps SaaS companies make smarter decisions about customer acquisition, retention, pricing, and product development.
Key Takeaways:
- What is Predictive CLV? It estimates future customer value using churn likelihood, spending patterns, and retention probabilities. Unlike traditional methods, it provides more accurate, data-driven forecasts.
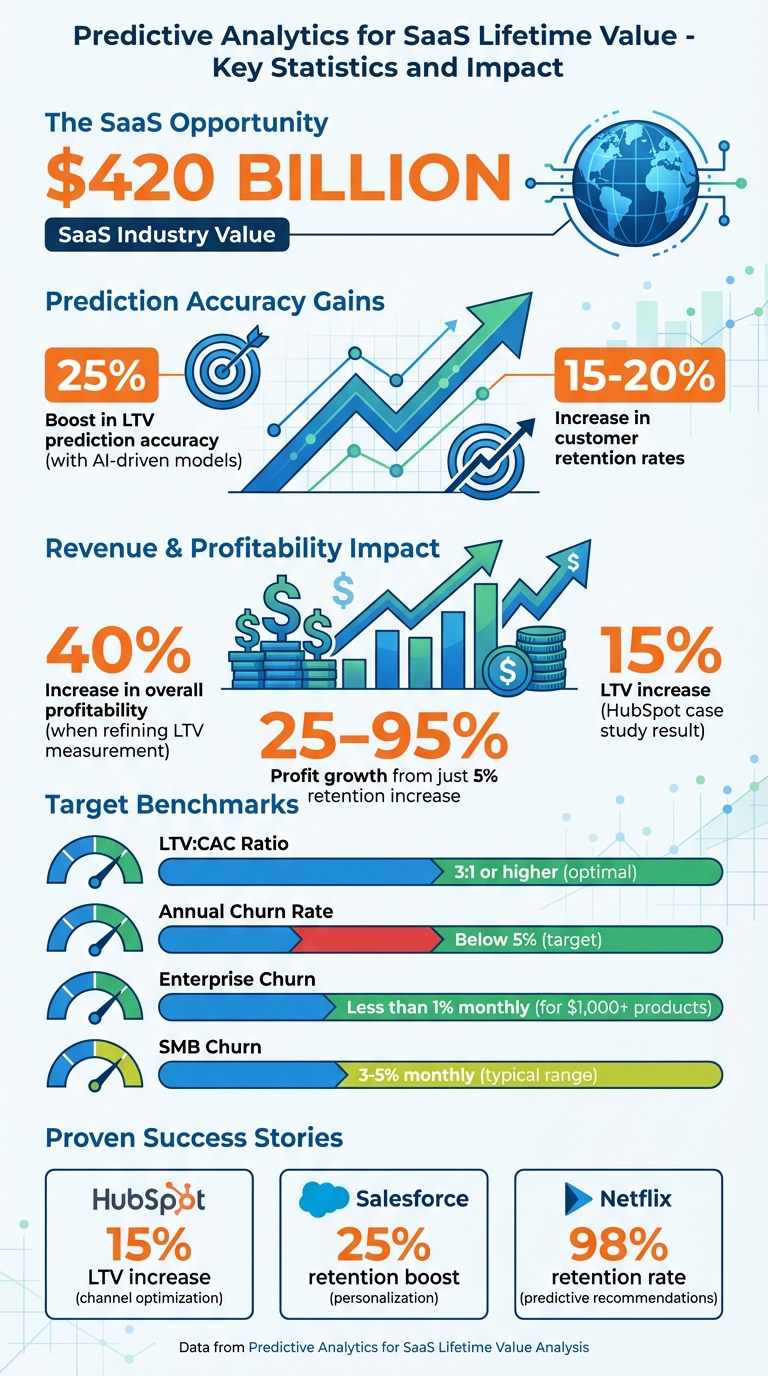
- Why It Matters: Companies using predictive models report up to a 25% boost in LTV prediction accuracy and a 15-20% increase in retention rates.
- Core Metrics Needed: Includes transactional data (e.g., ARPU), churn rates, and behavioral insights like feature adoption and engagement trends.
- Methods Used: Combines historical data with advanced analytics like customer segmentation, cohort analysis, and churn prediction.
- Practical Applications: Helps refine marketing strategies, personalize offers, optimize pricing, and guide product development.
By focusing on long-term customer relationships and leveraging predictive tools, SaaS businesses can improve profitability and reduce risks. The key is maintaining clean data, regularly updating models, and using insights to drive actions.
Predictive CLV Impact: Key Metrics and ROI for SaaS Businesses
Full Tutorial: Customer Lifetime Value CLV Forecasting in R (Feat. Modeltime)
Data Inputs Required for Predictive CLV Models
To build reliable predictive CLV models, you need a well-rounded dataset that captures both customer spending habits and behavioral patterns. Four key categories of data play a critical role in generating accurate predictions.
Core Metrics for CLV Prediction
Here are the four main data types essential for precise CLV forecasting:
- Transactional data: This includes metrics like Average Purchase Value (APV), Average Customer Value (ACV), purchase frequency, and total revenue per customer. These figures provide insight into customer spending patterns.
- Financial metrics: Metrics such as Average Revenue Per User (ARPU) - calculated by dividing Monthly Recurring Revenue (MRR) by the total number of users - are vital. You'll also need your subscription gross margin percentage and Cost of Goods Sold (COGS). Together, these allow you to calculate a margin-adjusted CLV, which reflects actual profitability rather than just revenue.
- Retention and churn metrics: Keep track of both logo churn (number of customers lost) and dollar-based churn (revenue lost through Gross Revenue Retention). Additionally, monitor the average customer lifespan. Since CLV is highly sensitive to churn, even a small 5% increase in churn can slash total CLV by 50%.
- Behavioral and demographic data: Metrics like engagement, feature adoption, and browsing behavior help identify high-value customer segments and predict potential churn risks. Adding demographic details and acquisition channels further supports segmentation and cohort analysis.
| Core Metric | SaaS Formula / Definition |
|---|---|
| Average Purchase Value (APV) | Total Revenue / Total Number of Purchases |
| Average Purchase Frequency | Total Number of Purchases / Number of Unique Customers |
| Average Customer Lifespan | 1 / Customer Churn Rate (or 1 / Retention Rate) |
| ARPU | Monthly Recurring Revenue (MRR) / Total Users |
How to Collect and Organize Your Data
Once you've identified the key metrics, the next step is gathering and organizing your data effectively. Use tools like CRM platforms, billing systems, and marketing automation software to pull in relevant information. Seamless system integration is crucial to avoid duplicate data and ensure you capture all churn signals.
Automate this process with unified analytics platforms like Baremetricss that consolidate data from sources like CRMs (e.g., HubSpot), payment processors (e.g., Stripe), and subscription management tools. Employ identity resolution techniques to create a single, unified customer record across all channels.
Regularly audit your data for missing fields or anomalies, as even small errors can skew predictive models. For smaller businesses with fewer than 100 users, include the entire dataset in your analysis. For larger businesses with 1,000–10,000 users, a 10% sample is usually sufficient. Additionally, apply a conservative discount rate (typically around 0.75) to account for cash flow losses and churn variability.
Segmenting your data by cohorts - such as acquisition month or product tier - can uncover trends that overall metrics might miss. For example, you might identify "cohort cliffs" where churn spikes during the first month. This kind of segmentation lays the groundwork for deeper analysis, which will be explored in later sections.
Methods for Predictive CLV Analysis
After organizing your data, the next step is selecting the right methods to forecast Customer Lifetime Value (CLV). SaaS businesses often combine simple historical calculations with more advanced techniques, like machine learning models, depending on their data capabilities and business needs.
Using Historical Data and Behavioral Modeling
A traditional starting point is the formula: LTV = ARPU / Churn Rate or LTV = ARPU × Customer Lifetime. This method relies on historical transaction data, such as subscription renewals, upsells, and downgrades, to identify patterns in spending. For example, you might see seasonal spikes in renewals or notice that specific customer segments tend to upgrade their plans after three months. Baremetrics can do all this for you.
Behavioral modeling takes this further by incorporating non-transactional data, like product engagement, support ticket frequency, and feature adoption. These behaviors can signal future value. For instance, customers who attend webinars might show a 30% higher LTV compared to those who don't. Advanced models, such as regression analysis or neural networks, combine historical and behavioral data to provide more accurate revenue forecasts. This deeper analysis also enables more precise segmentation and cohort studies.
Customer Segmentation and Cohort Analysis
Breaking your customer base into smaller, behavior-based groups turns CLV into an actionable metric. For instance, cohort analysis by acquisition channel can uncover differences in LTV. HubSpot used this approach to compare customers acquired through SEO versus paid ads, reallocating their marketing spend to higher-performing channels. This adjustment led to a 15% increase in overall LTV within a year.
Cohort analysis also tracks customers by their sign-up date (e.g., a "July cohort") to observe how behavior and churn rates shift over time. This helps identify "cohort cliffs", such as a sharp churn increase after the first month. Salesforce categorized users by industry and company size, tailoring their marketing and support strategies accordingly. This targeted approach boosted customer retention rates by 25%.
Segmenting by pricing tier is especially useful, as lower-cost plans typically experience higher churn and lower LTV compared to enterprise-level plans. Geographic segmentation can also highlight regional differences in metrics like ARPU and retention. Together, these segmentation techniques sharpen your predictive insights and support better churn management and risk assessment.
Predicting Churn and Assessing Risk
Accurately predicting churn is essential for reliable CLV forecasting. Predictive analytics tools analyze factors like engagement levels, payment history, and product usage to identify at-risk accounts before they churn. Businesses using these tools have reported a 15–20% improvement in customer retention rates.
The financial impact of churn is significant - a 5% increase in retention can lead to a 25% to 95% boost in profits. Successful SaaS companies aim for annual churn rates below 5% and strive for an LTV to CAC (Customer Acquisition Cost) ratio of 3:1 or higher. Netflix, for example, uses big data to personalize content recommendations based on viewing habits, achieving a 98% retention rate in certain segments and extending customer lifespans.
Monitoring early warning signs - like declining logins, reduced feature usage, or an increase in support complaints - can help flag accounts at risk of churning. When combined with historical churn data, these indicators generate dynamic risk scores that adjust CLV predictions in real time. This proactive approach allows businesses to intervene early, refine forecasts, and respond effectively as customer behavior evolves.
How to Use Predictive CLV in Your SaaS Business
Once you've built predictive CLV models, you can use their insights to make smarter decisions in marketing, customer retention, pricing, and product development.
Improving Customer Acquisition and Retention
Predictive CLV helps you fine-tune your Ideal Customer Profile (ICP) by identifying which customer segments deliver the most long-term value. Instead of focusing on acquiring the cheapest leads, you can prioritize prospects who resemble your most profitable customers. For instance, analyzing LTV by acquisition source can show whether SEO or paid ads bring in customers who stick around and spend more over time.
Take HubSpot as an example: they shifted their marketing budget toward channels that attracted high-LTV customers, leading to a 15% increase in LTV within a year. This approach moves the focus away from short-term gains and toward long-term profitability.
You can also dig deeper by interviewing your high-LTV customers - those whose LTV far exceeds the average. Ask them about the features they value most and how they found your product. These insights can help you refine your acquisition strategy and identify opportunities to upsell or cross-sell, boosting CLV among your existing customers.
By aligning your acquisition and retention strategies with these insights, you’ll also create more personalized customer experiences.
Personalizing Offers and Marketing Campaigns
Predictive CLV makes it easier to tailor promotions to your highest-value segments. For example, predictive models can highlight early signs of potential upsell opportunities, such as a customer increasing their feature usage or expanding their team. This allows you to send targeted offers - like upgrading from a basic plan to an enterprise tier - at just the right moment.
Salesforce uses predicted CLV to segment customers and deliver personalized offers, resulting in a 25% boost in retention. Similarly, Netflix applies predicted viewing behavior to recommend content, helping them achieve a 98% retention rate in certain user segments.
For customers at risk of churning, proactive re-engagement emails can help re-establish their connection with your product. Meanwhile, high-usage customers on lower-tier plans are great candidates for upsell campaigns that highlight advanced features they’re likely to need. In fact, 71% of consumers now expect personalized interactions from brands, making segmentation a key competitive edge.
These personalized strategies also pave the way for smarter pricing and product decisions.
Refining Pricing Strategies and Product Development
Predictive CLV isn’t just for marketing - it’s also a powerful tool for shaping your pricing and product strategies. By analyzing LTV across pricing tiers, you can identify which plans are sustainable. For instance, lower-cost plans often come with higher churn and lower LTV, signaling potential pricing or acquisition strategy adjustments.
Talking to high-LTV customers can reveal which features keep them engaged, providing guidance for your product roadmap. You can also use predictive models to test potential pricing changes. For example, simulate how a 1% increase in churn or a shift in pricing tiers might affect Annual Recurring Revenue (ARR) and cash flow before implementing changes.
For usage-based pricing models - like per seat or per API call - predictive CLV can track behavioral trends to forecast revenue and adjust pricing caps or tiers as needed. Keeping an eye on Time to Value (TTV) (the time it takes for customers to experience your product’s core benefit) is crucial here. Faster TTV often indicates higher predicted LTV. SaaS companies that excel in these areas can see up to a 40% increase in overall profitability.
| Business Function | CLV Application | Expected Impact |
|---|---|---|
| Customer Acquisition | Refine ICP and optimize channel spend | 15% increase in LTV (HubSpot example) |
| Retention & Support | Proactive outreach to at-risk segments | 15–20% improvement in retention rates |
| Marketing Campaigns | Personalized upsell and re-engagement offers | 25% boost in retention (Salesforce example) |
| Pricing Strategy | Tier optimization based on segment LTV | Up to 40% increase in profitability |
| Product Development | Feature prioritization from high-LTV interviews | Faster TTV and higher customer satisfaction |
sbb-itb-18a9912
Tools for Predictive CLV Forecasting
Analytics platforms capable of delivering predictive insights can turn raw data into accurate revenue forecasts. For SaaS businesses, it's essential to use tools that offer more than basic reporting, providing deeper predictive insights.
How Baremetrics Supports Predictive CLV Analysis
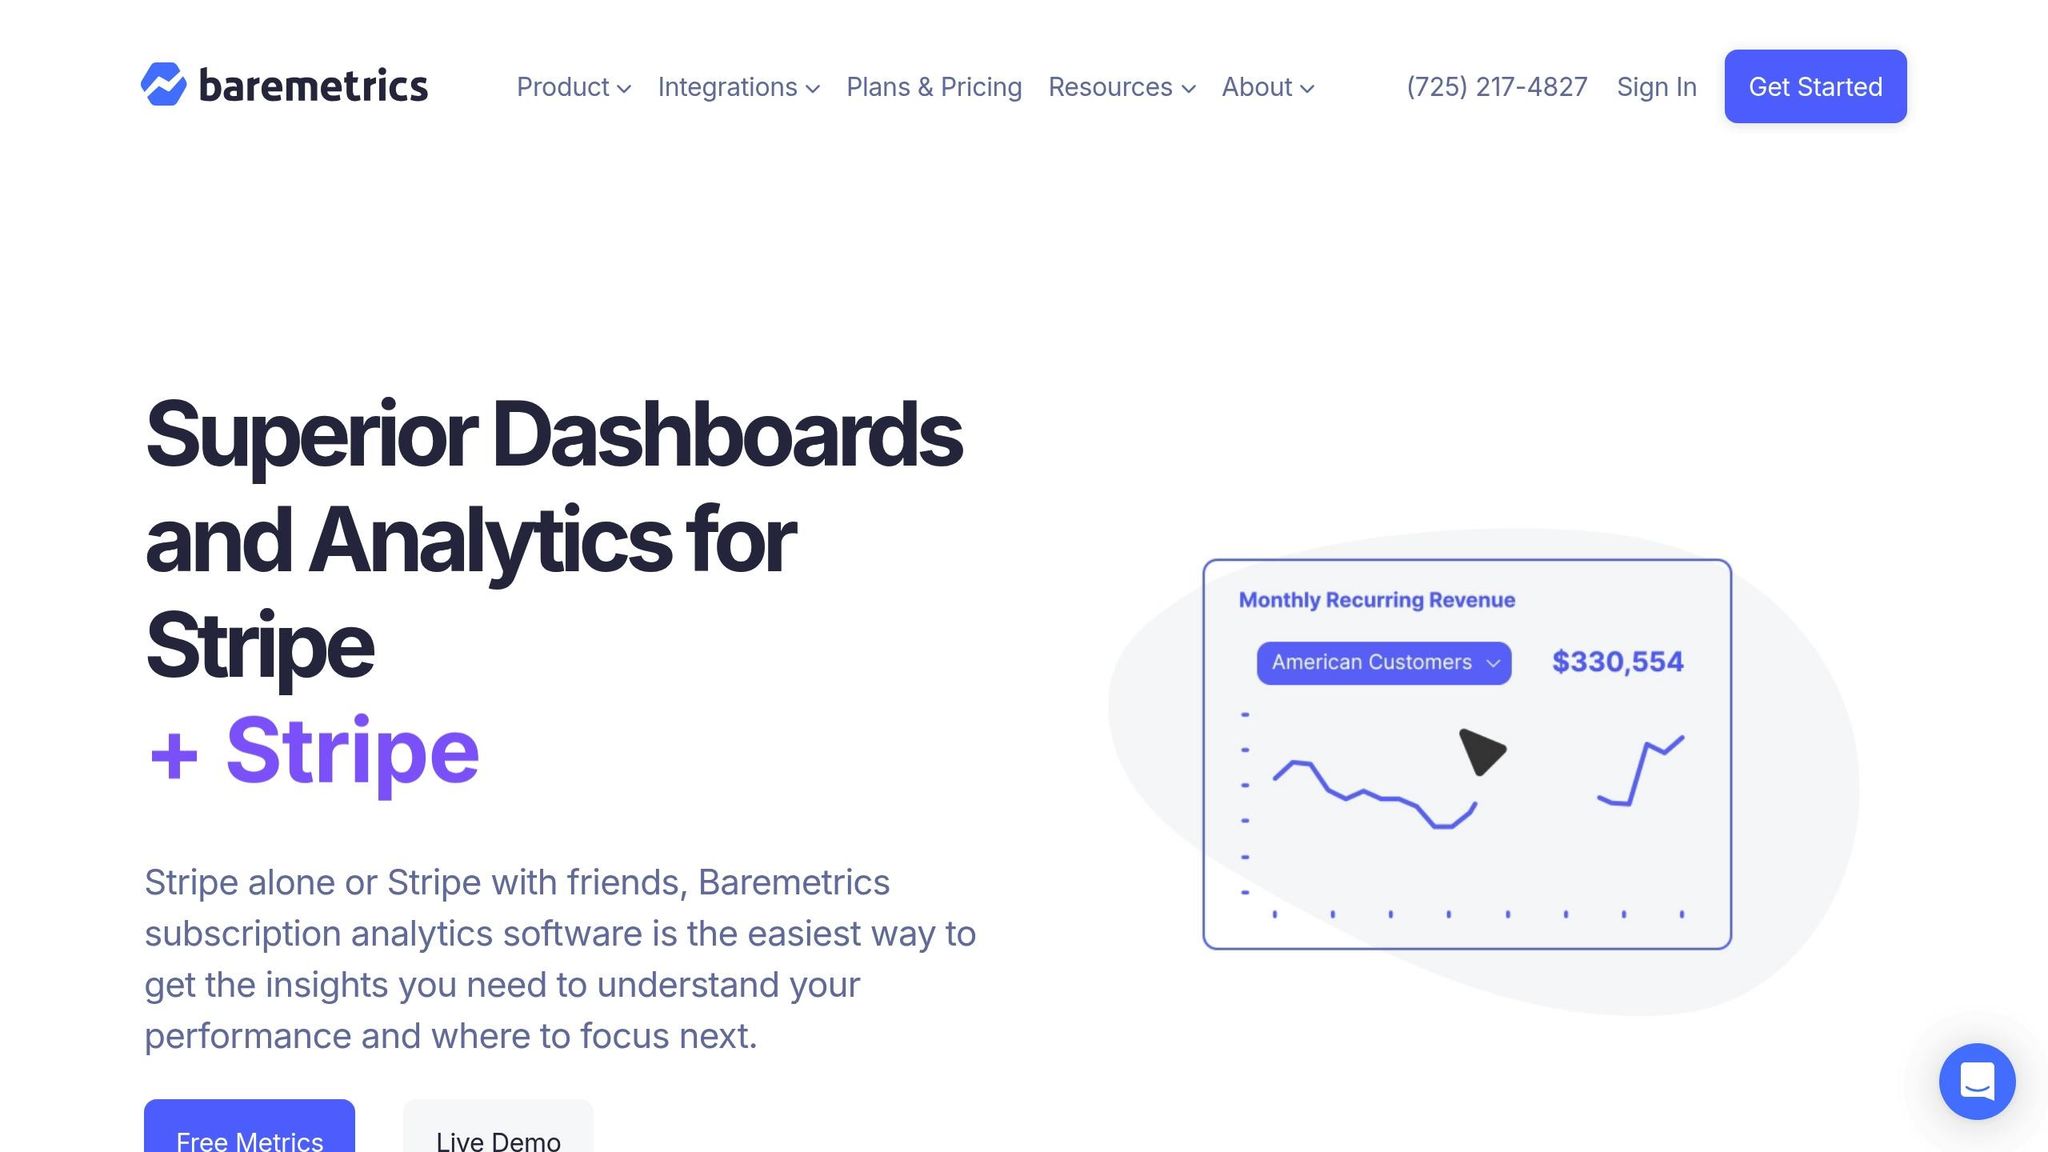
Baremetrics takes subscription data and converts it into actionable CLV forecasts through real-time tracking and automated segmentation. Forget about manual spreadsheet calculations - this platform updates metrics like LTV, ARPU, and churn automatically as new data comes in from your payment processors.
With its segmentation features, Baremetrics allows you to analyze LTV data across various dimensions, such as pricing plans, geographic regions, acquisition sources, and signup dates. This helps identify which customer groups bring the most value over time.
The platform also includes Cancellation Insights, which shed light on why customers leave. These insights feed directly into your predictive models, enhancing their accuracy. Baremetrics’ forecasting tools rely on historical trends to predict future revenue, achieving over 90% accuracy for products with at least 2,000 paid subscriptions.
Another standout feature is Benchmarks, which lets you compare your LTV and churn rates to those of similar companies, offering valuable context for your performance metrics.
Connecting Data Sources for Better Insights
To achieve precise CLV forecasting, it's crucial to unify your data streams. Baremetrics integrates seamlessly with platforms like Stripe, Braintree, Chargebee, Recurly, Shopify, Apple App Store, and Google Play Store. For more customized setups, the Universal Connector and Analytics API allow you to bring in data from unsupported platforms, consolidating everything into a single dashboard.
Best Practices for Predictive CLV Models
Creating a predictive CLV model is just the start. To ensure it delivers actionable insights and remains accurate, you need to focus on maintaining data quality, refining your approach, and avoiding common pitfalls. Let’s dive into the steps that will keep your model effective.
Maintaining Data Quality and Accuracy
To get reliable results, your data must be clean and consistent. Start by removing anomalies like null CustomerIDs or negative transaction values - they can skew your revenue patterns. Also, ensure your sample size is large enough to be statistically valid. Here’s a quick guide:
| User Base Size | Required Data for Scientific Validity |
|---|---|
| Less than 100 users | 50% to 100% of user data |
| 1,000 to 10,000 users | 10% of user data |
| More than 1,000,000 users | 1% of user data |
Once your data is in shape, keep an eye out for model drift. Metrics like Mean Absolute Error (MAE) and Root Mean Squared Error (RMSE) are key indicators. If these error rates start climbing, it’s a sign your model is falling out of sync with customer behavior. Set up automated alerts to flag when these metrics exceed acceptable thresholds, so you can retrain your model before it impacts your decisions. Regular retraining - monthly or quarterly - is also essential to account for shifts like seasonality, economic changes, or new product launches.
Testing and Refining Your Models
Refining your model is an ongoing process. For instance, applying a discount rate of 0.75 can help account for early churn drop-offs. Additionally, capping your LTV projections at 24 months ensures you avoid overly optimistic long-term predictions that rarely hold true.
Between retraining cycles, take time to interview customers whose lifetime value exceeds the average. These conversations can reveal what keeps high-value customers engaged, allowing you to fine-tune both your model and your product strategy. This kind of insight directly supports better decisions around customer acquisition, retention, and pricing.
Common Mistakes to Avoid
There are a few pitfalls that can derail your predictive CLV model:
- Overfitting: This happens when your model is overly tailored to historical data, making it less effective at predicting future behavior. Insufficient sample sizes or ignoring statistical validity guidelines often lead to this issue.
- Ignoring external factors: Market shifts, competitive changes, and seasonal trends can all impact customer behavior. If your model doesn’t account for these, its predictions will be off.
- Treating CLV as static: Customer behavior evolves over time. Your model needs to adapt to changes in pricing, product features, and other variables.
- Over-optimistic projections: For example, small business-focused SaaS products typically see a monthly churn rate between 3% and 5%, while enterprise products ($1,000+ per month) aim for less than 1%. If your model predicts retention rates far better than these benchmarks without strong evidence, it’s a red flag to revisit your assumptions.
Conclusion
Predictive analytics is changing how SaaS companies understand and maximize customer value. By forecasting revenue potential and identifying churn risks early, businesses can make smarter decisions about resource allocation and marketing strategies. With the SaaS industry valued at $420 billion, leveraging customer lifetime value (CLV) insights is a critical strategy for success. Top-performing companies use CLV to steer decisions across product development, marketing, and overall growth.
The results speak for themselves: businesses using AI-driven predictive models have seen a 25% improvement in LTV prediction accuracy. These same tools have helped companies increase customer retention rates by 15–20%. Even more striking, refining LTV measurement can boost profitability by as much as 40%. These improvements can be the difference between thriving in the market and struggling with inefficiencies.
Key Takeaways for SaaS Businesses
Here are some actionable steps to turn insights into measurable outcomes:
- Start with clean, well-organized data. Segment customers by pricing tier, acquisition source, and location to identify which groups bring the most value. Tools like Baremetrics simplify this process by integrating directly with payment platforms like Stripe and Chargebee, offering real-time insights without manual effort.
- Maintain a healthy LTV:CAC ratio - aim for at least 3:1 to ensure customer acquisition remains profitable. Use cohort analysis and segmentation to monitor behavior over time, and tackle involuntary churn with automated dunning tools. As Tushar Mahajan from Statusbrew shared:
"Recover helped us reduce our churn and save over $10k+ in less than 3 months"
- Even small changes can have a big impact. For instance, a 5% increase in customer retention can lead to profit growth of 25% to 95%.
Predictive CLV is not a one-and-done process - it requires constant updates as customer behaviors evolve. Talk to your most valuable customers to learn what keeps them engaged, experiment with different forecasting scenarios, and avoid overly optimistic assumptions. By following these practices, you can drive sustainable growth and build stronger, long-term customer relationships. Predictive analytics isn’t just a tool - it’s a competitive advantage for SaaS businesses looking to move beyond transactions and focus on lasting profitability.
One churn lever most strategies under-invest in
The strategies above target voluntary churn — the customers who actively decide to leave. But research from Paddle puts involuntary churn at 20–40% of total subscription churn: customers whose payments failed and were never recovered. It's almost entirely preventable with a structured dunning system. Across 148 Baremetrics customers using Recover for dunning automation in December 2024, $1.35 million was reclaimed in a single month, with 82% of customers seeing the tool pay for itself within month one. The mechanics are covered in our complete guide to involuntary churn and the end-to-end dunning management system that prevents it.