
Table of Contents
Most founders don't go looking for a subscription analytics tool until something breaks. Usually it's a board deck, a new hire asking a question nobody can answer, or the slow realization that the Stripe dashboard was never built to tell you how the business is doing.
By the time you're comparing Baremetrics, ChartMogul, and MRR.io, you've already made the decision that matters. You know you need something. What you're actually trying to work out is which one fits where you are right now — and which one you'll outgrow in eight months.
SaaS founders and ops leads usually start shopping for subscription analytics because they're tired of:
- Piecing metrics together from three different dashboards every time someone asks how growth is going
- Stripe reporting that shows transactions but never explains why MRR moved — what was new, what expanded, what churned silently
- Watching failed payments pile up with no automated way to recover them
- Finding out a customer cancelled weeks after the window to save them closed
- Having no way to answer "what's our runway" without opening a separate spreadsheet and a separate accounting tool
All three are real products with real users. They're also aimed at meaningfully different buyers.
Want to see your own numbers instead of a feature list? Baremetrics connects to Stripe in a few minutes and pulls your full history — no spreadsheet, no engineering time. Start a free trial or book a call and we'll build your first dashboards with you.
Baremetrics
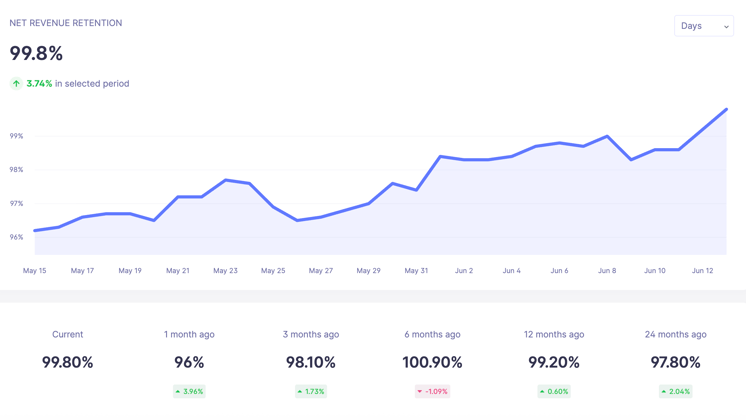
NRR in Baremetrics
Baremetrics is a subscription analytics and revenue platform for SaaS companies that want to both see their metrics and act on them. It connects natively to Stripe, Braintree, Chargebee, Recurly, Shopify, the Apple App Store, and Google Play, and normalizes everything into one unified MRR figure you can still segment by source.
The core dashboard covers MRR with a full movement breakout, net revenue, fees, active customers, ARPU, LTV, user and revenue churn, growth rate, at-risk revenue, failed charges, and cohort retention tables. That part is table stakes — ChartMogul does it too.
Where Baremetrics separates is in the layer on top: tooling that does something about the churn and failed payments the dashboard surfaces, and financial forecasting that connects SaaS metrics to the actual health of the business.
Key feature #1: MRR waterfall
Stripe will tell you that money arrived. It won't tell you that $4,000 of new MRR was offset by $3,600 of contraction, or that your growth last month was mostly reactivations rather than new customers.
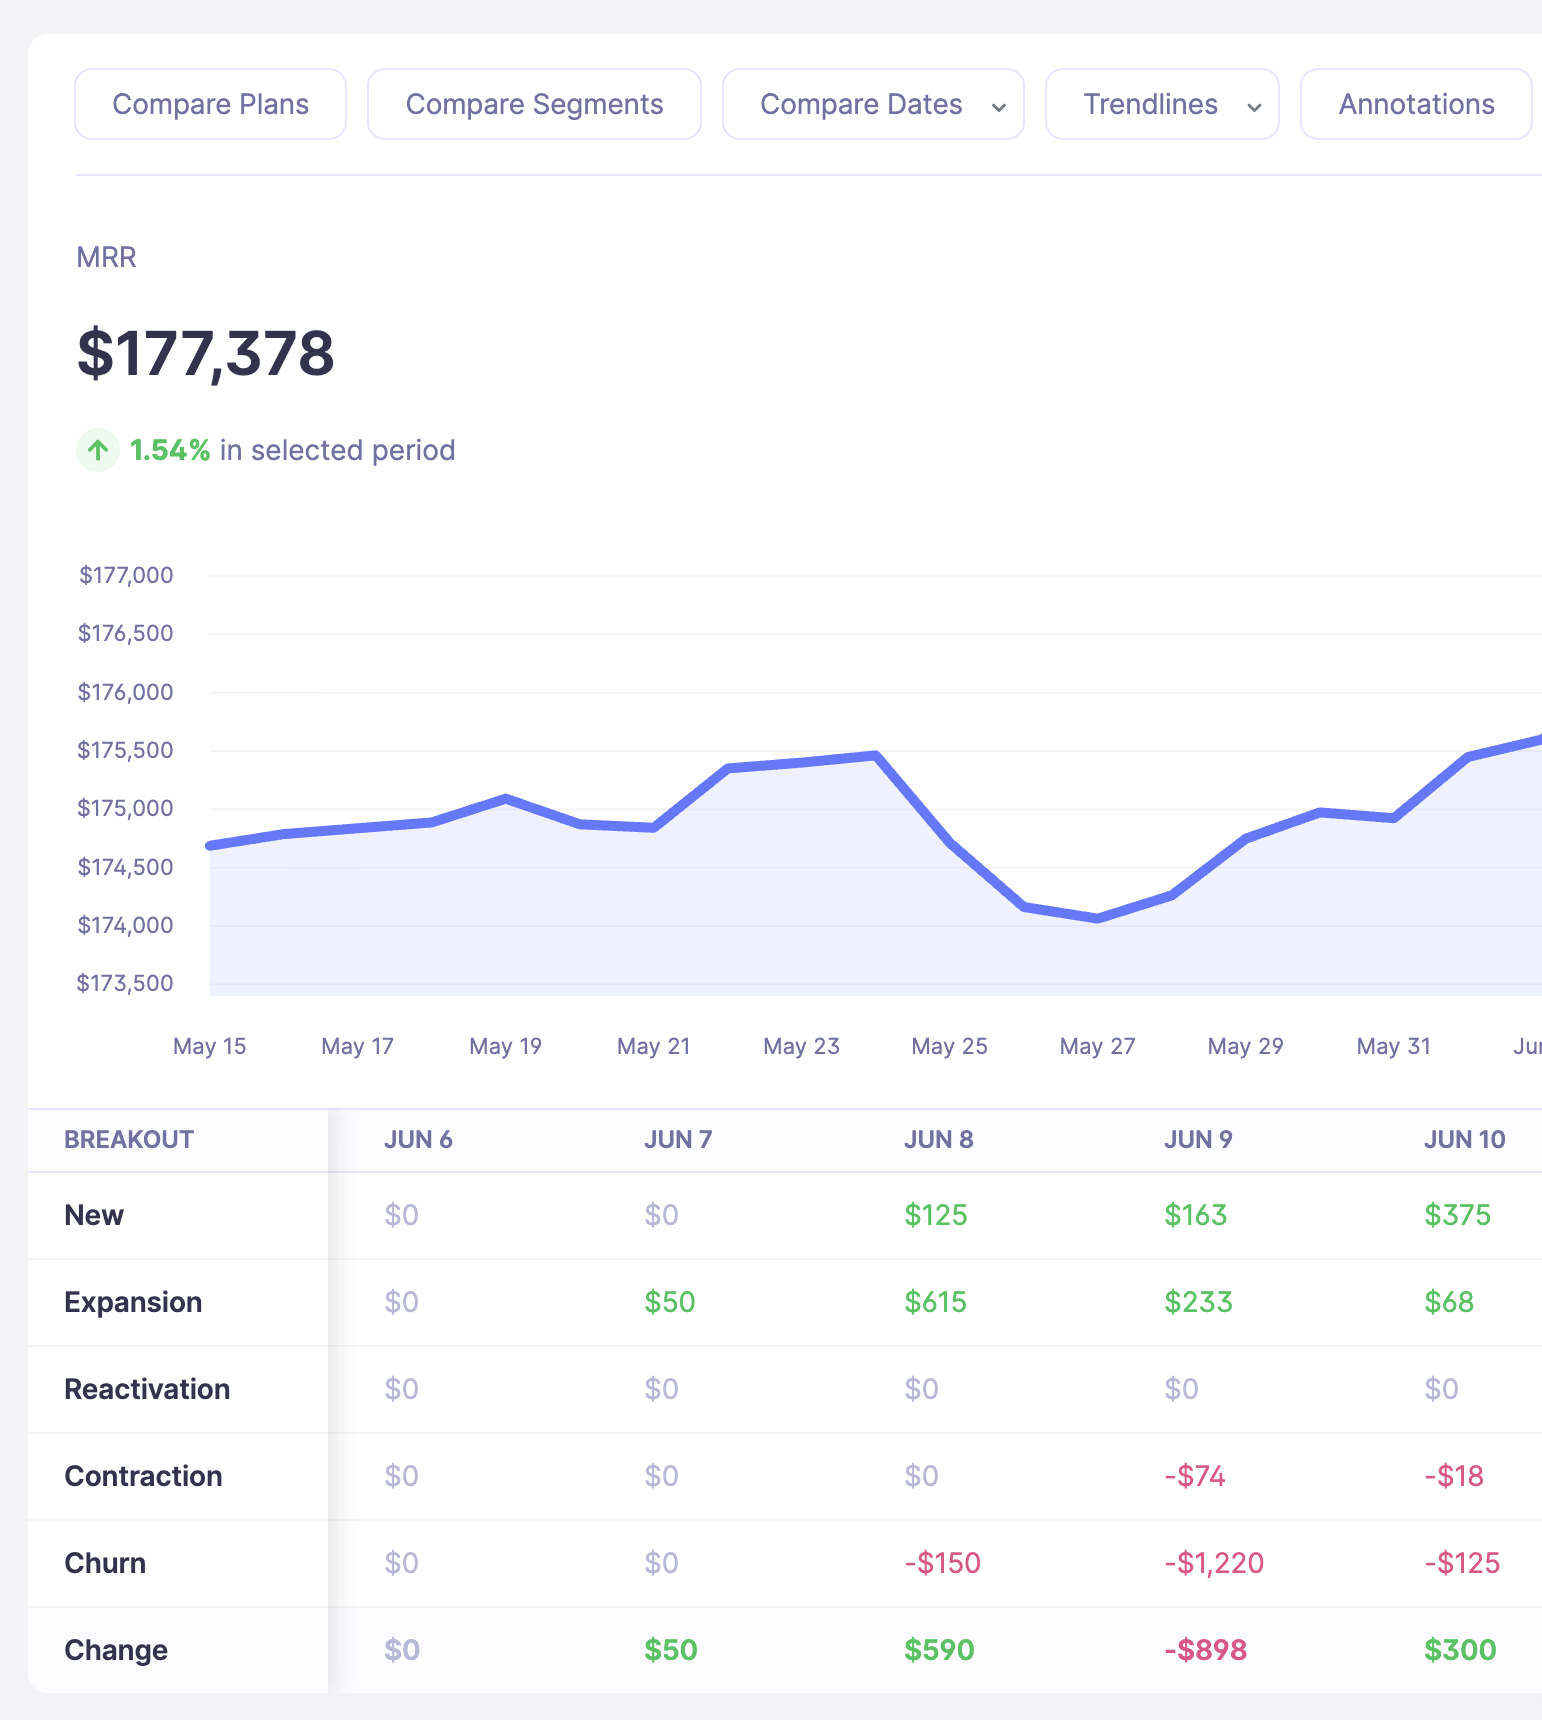
MRR waterfall in Baremetrics
Baremetrics breaks MRR into New, Expansion, Reactivation, Contraction, and Churn, and shows net change by day, week, month, or quarter. Every movement is clickable down to the individual customer and the event that caused it.
Say you're a founder who's been running on Stripe alone for two years and has never tracked net revenue retention. You connect Baremetrics, it backfills your full history, and within minutes you can see that month-2 is where customers consistently drop off — not month-6, which is where you'd been aiming your retention effort. That's not a metric you can compute from the Stripe dashboard without exporting to a spreadsheet first.
Annotations let you mark events directly on the graph (like a pricing change, a marketing push, or an outage) so six months later you can still explain what caused the spike.
Key feature #2: Unlimited segmentation and custom dashboards
The usual pattern with metrics tools is that you get one dashboard for the whole business, and any question that requires slicing it means building a new spreadsheet.
![Baremetrics Dashboard [2026]](https://baremetrics.com/hs-fs/hubfs/Baremetrics%20Dashboard%20%5B2026%5D.png?width=749&height=391&name=Baremetrics%20Dashboard%20%5B2026%5D.png)
Custom dashboard in Baremetrics
Baremetrics gives you unlimited segments and unlimited custom dashboards. You can filter by country, plan name, price point, billing cadence, Stripe metadata, custom attributes pushed via API, HubSpot properties, or Intercom data — then save that view as its own dashboard and share it with the team or keep it private.
A practical version: you're an ops lead who wants MRR broken down by the AE who closed the account. You sync HubSpot, which maps deal owner onto the Stripe customer record, then build a segment per AE and overlay them on the same graph. The CEO gets one dashboard, the head of accounts gets another, each filtered to what they care about. Nobody's rebuilding a sheet.
This is worth flagging honestly: ChartMogul also has segmentation on every plan. The difference is in the ceiling. ChartMogul caps how many dashboards a user can create. Baremetrics caps neither segments nor dashboards.
Key feature #3: Payment recovery
Most SaaS companies leak revenue through failed charges and never build a recovery process, because building one means writing email sequences, hosting a card-update page, and tracking what worked.
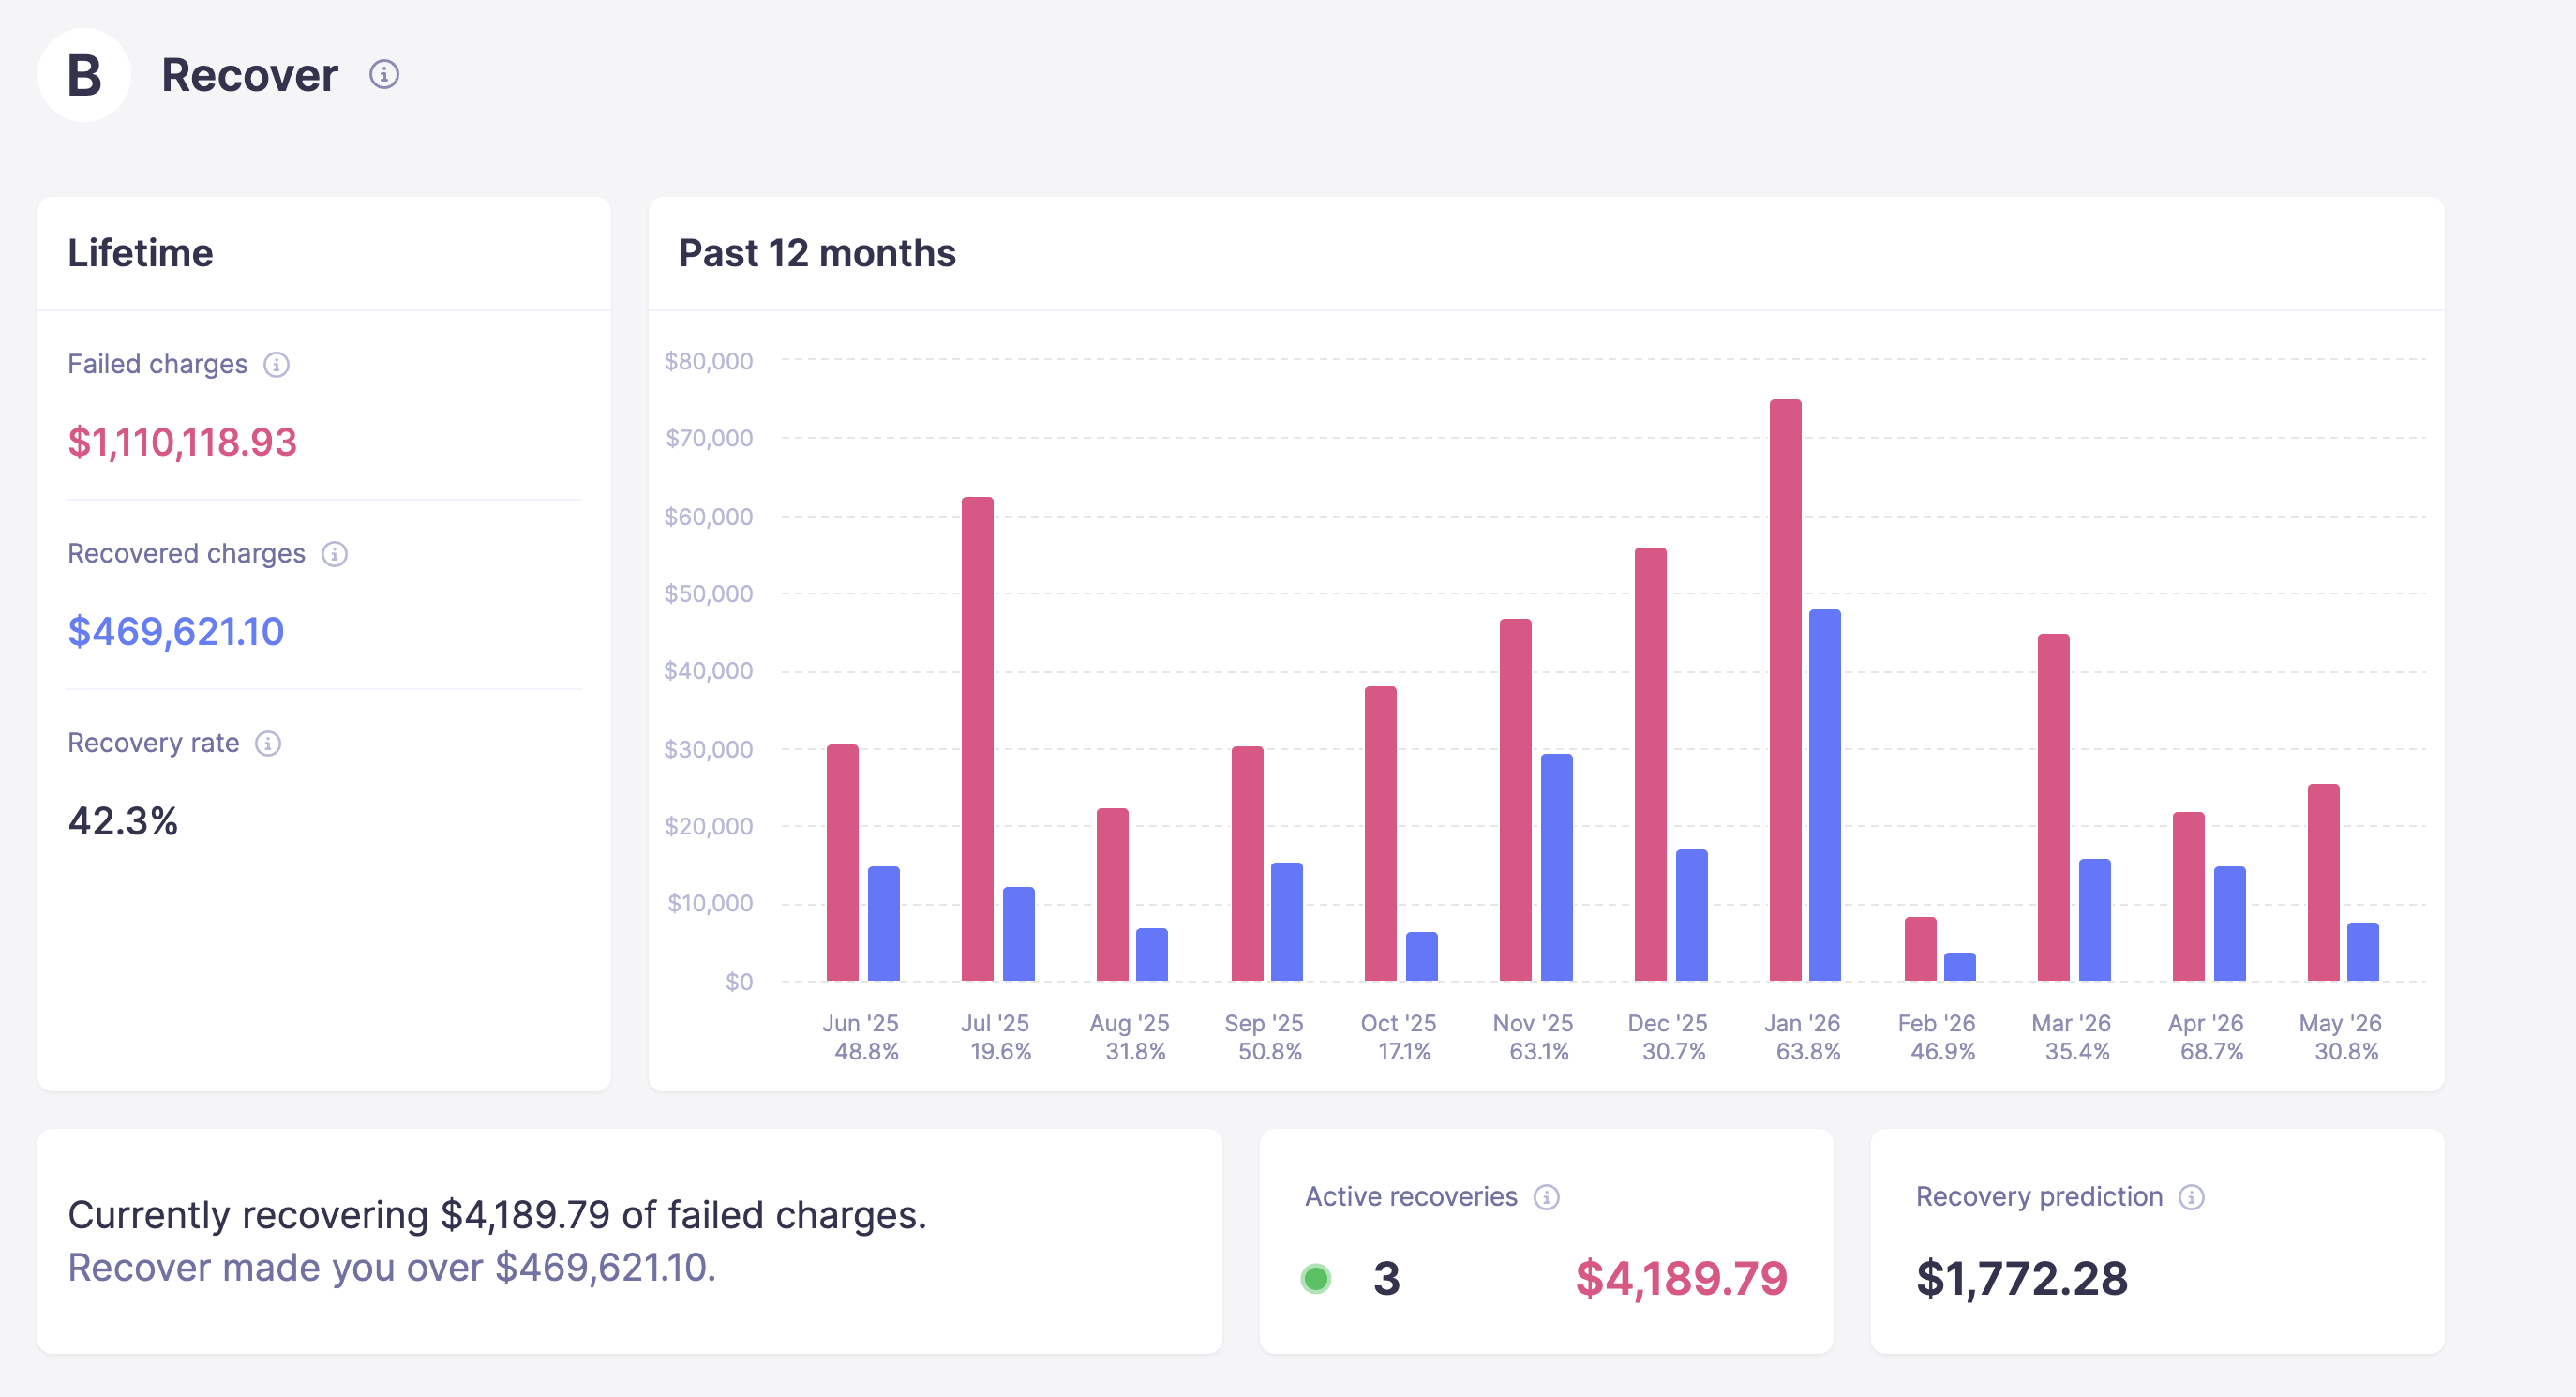
Recover dashboard in Baremetrics
Baremetrics Recover runs that automatically. When a customer goes delinquent, it triggers a sequence of up to seven customizable emails — sender name, subject, and body all editable. Alongside that, you can turn on annual renewal reminders and credit card expiration warnings that fire 30 days and 7 days before a card expires, which catches a chunk of failures before they ever happen.
Customers land on a branded billing widget carrying your logo and colors, update their card, and the update goes straight to your billing system. Baremetrics never stores card data. If someone ignores the emails, an in-app banner shows while they're logged in during a grace period you set, and after that the banner becomes a paywall. SMS recovery is available as an optional add-on.
The recovery dashboard tracks failed charge volume, attempts, amount recovered, recovery rate, and per-email open, click, and recovery rates, so you can see which message in the sequence is doing the work.
One scoping note: Recover works with Stripe, Braintree, and Recurly. If your subscriptions run through Shopify, Apple, or Google Play, Recover won't cover those sources.
Key feature #4: Cancellation Insights
By the time churn shows up in your dashboard, the customer is gone and you don't know why.
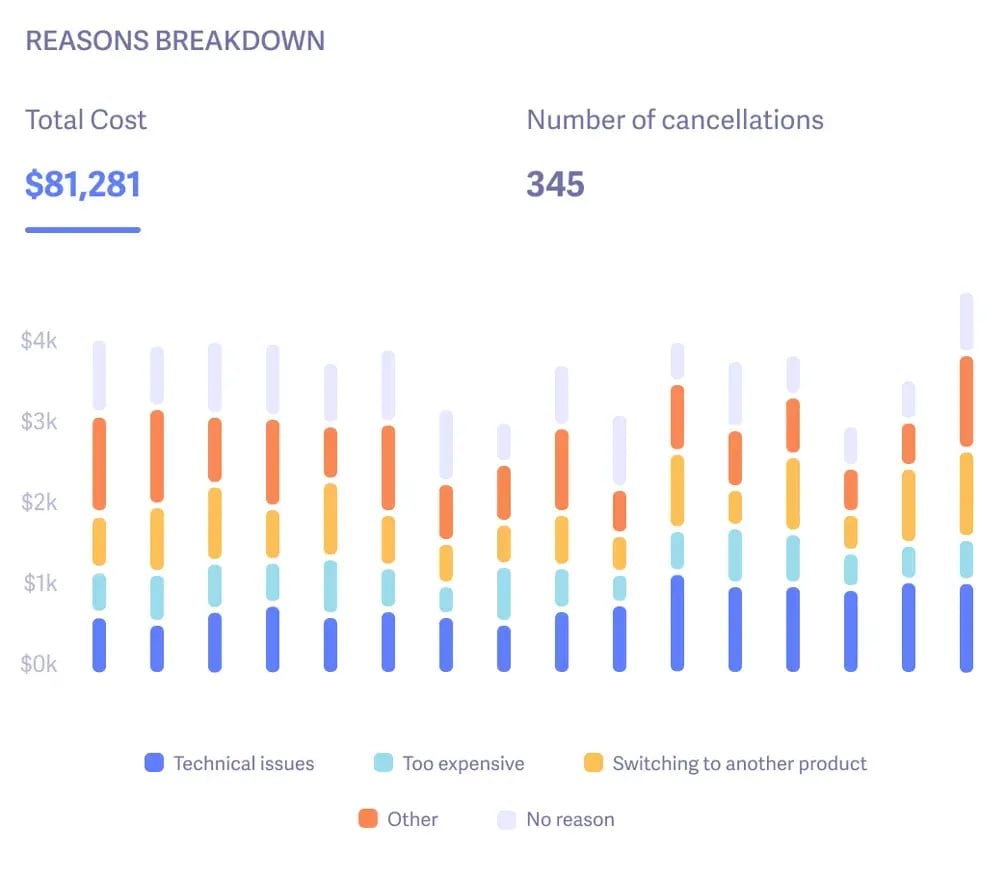
Cancellation reasons breakdown in Baremetrics
Cancellation Insights installs a widget on your cancel button. When someone clicks it, they pick a reason from a list you configure — switching to a competitor, too expensive, missing a feature, whatever actually applies to your product — before the cancellation processes. Each reason can trigger its own follow-up sequence, so the person leaving on price gets a different email than the person leaving for a competitor.
Setup runs about 30 minutes and then it works in the background. Retention Offers are included at no extra cost. Today they're discount-only, with any discount applied automatically to the subscription; pause and trial extension are coming soon.
Key feature #5: Forecast+
This is the clearest structural difference between Baremetrics and both other tools on this list.
SaaS metrics tell you about revenue. They don't tell you whether the business is healthy. If MRR is climbing but expenses are climbing faster, a subscription analytics dashboard will show you a nice graph while you run out of money.
![Forecast+ Dashboard [Screened in]](https://baremetrics.com/hs-fs/hubfs/Forecast+%20Dashboard%20%5BScreened%20in%5D.png?width=2668&height=1472&name=Forecast+%20Dashboard%20%5BScreened%20in%5D.png)
Forecast+ dashboard in Baremetrics
Baremetrics Forecast+ is included free with any paid Metrics plan. Neither of the other tools here offers financial forecasting at any price. It connects natively to QuickBooks Online or Xero, or takes a CSV, and ingests your P&L line by line, month by month. You get revenue, profit, bank balance, runway, burn rate, expense breakdown by department and fixed vs. variable, net profit margin, customer acquisition cost, and budget variance against plan. Target, Base, and Worst Case model side by side.
Close your books, sync, and the dashboard updates in seconds. Most people come to Baremetrics for the SaaS metrics and treat Forecast+ as the thing they didn't know they needed until a board meeting.
Key feature #6: Support that actually gets on a call
This one is hard to put in a feature table but it comes up in nearly every conversation with people switching tools.
Baremetrics offers unlimited onboarding calls with no cap during trial or after purchase, live chat with a real person 9am–5pm EST usually answered within minutes, and hands-on working sessions where the team builds your segments, dashboards, and recovery flows with you rather than sending you a help doc.
If you're migrating off a spreadsheet you've been maintaining for three years, that matters more than any single feature.
Ready to see it against your own data? Start a free trial — Stripe connects in minutes and backfills your full history. Or book a call and we'll set up your first segments live.
ChartMogul
ChartMogul is the closest direct comparison to Baremetrics on this list. On core subscription analytics the two are genuinely neck and neck — MRR, churn, LTV, cohort retention, segmentation, ARR forecast modeling. If you're only evaluating core metrics, you will not find a meaningful gap.
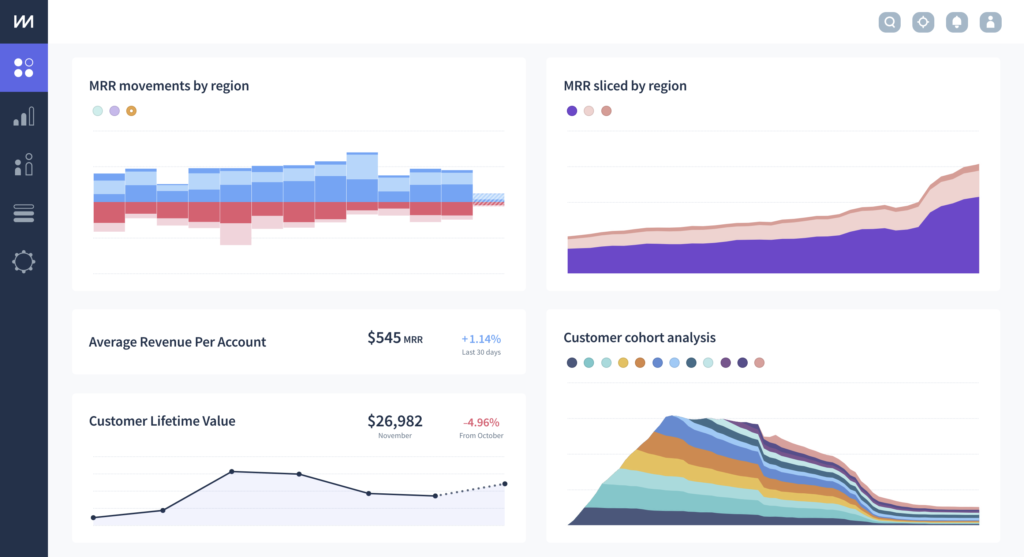
Where ChartMogul has gone in its own direction is CRM. It ships a native CRM on every plan, including the free one, covering opportunity management, tasks, @mentions, and email outreach, with sequencing available on CRM Pro at $39 per user per month. For a team that wants sales and customer success workflow living inside the analytics tool rather than in a separate system, that's a real advantage Baremetrics doesn't match — we integrate with HubSpot rather than shipping our own CRM layer.
ChartMogul also offers stage- and ARR-specific industry benchmarks, where Baremetrics benchmarks against general SaaS. And on Pro and above, it supports data warehouse exports to Snowflake, BigQuery, Redshift, S3, and Azure, which Baremetrics does not currently offer.
Native data sources: Stripe, Chargebee, Paddle, Recurly, Braintree, PayPal, GoCardless, and others. PayPal and GoCardless are both native for ChartMogul and not for Baremetrics.
Pricing:
- Free — $0 up to $10K MRR / $120K ARR. Core analytics, segmentation, one billing source, a CRM seat, revenue forecast modeling, and benchmarks.
- Starter — from $59/month billed annually or $69 monthly. Up to $10M ARR, one billing source, up to three team members.
- Pro — from $99/month billed annually or $119 monthly. Multiple billing sources, unlimited team members, data warehouse exports, two-way CRM sync.
- Enterprise — from $19,900/year.
- Startup program — $50/month discount for 12 months on any paid plan.
Where it doesn't reach: ChartMogul's forecasting stays inside the SaaS metrics layer. It models what ARR looks like in 12 months under different growth assumptions, which is useful, but it doesn't ingest your P&L, and there's no runway, burn rate, expense breakdown, or CAC. Failed payment recovery isn't native either. Instead, it's handled through third-party partners in their ecosystem rather than built in.
MRR.io
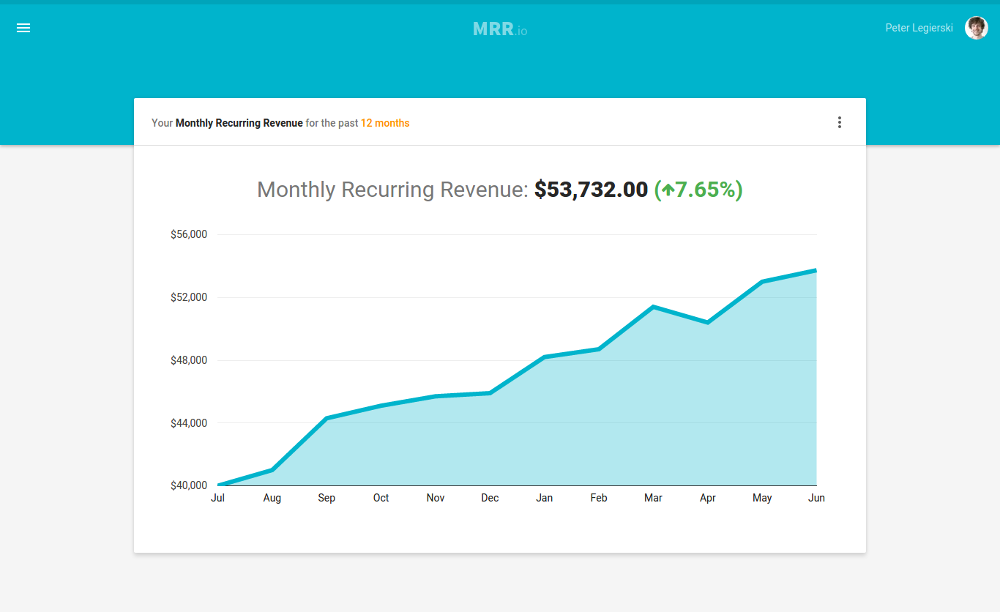
MRR.io is a lightweight metrics dashboard built and operated out of London. It covers a solid set of essentials: MRR, net revenue, MRR movement, gross and net revenue churn plus customer churn, ARR run rate, LTV, ARPU, refunds, failed charges, and upgrades and downgrades. The Pro plan adds cohort analysis, metric forecasts, and email reports.
It's the most honest kind of product on this list — it knows exactly what it is. It reports your metrics clearly and doesn't try to be a platform.
Native data sources: Stripe and Paddle only. Everything else — PayPal, Chargebee, Recurly, Braintree, Authorize.net — requires manual entry or work against their read/write API.
Pricing: MRR.io prices by paying customer count rather than by revenue, which is a genuinely different structure and worth understanding before you commit.
- Basic — free, up to 100 paying customers and 3 team members, with basic email reports
- Pro — $19/mo up to 250 customers, $39 up to 500, $69 up to 1,000, $129 up to 2,500, $199 up to 5,000, $299 up to 10,000. 30-day free trial.
That pricing model has a sharp edge in both directions. A high-ARPU business with 80 enterprise customers can run on the free tier indefinitely, and no other tool here will beat that. But a low-ARPU, high-volume product pays for the volume. A $9/month app with 2,500 customers — roughly $22.5K MRR — pays $129/month for a dashboard. Baremetrics starts at $49/month on Launch and includes a path to recovery tooling.
Where it doesn't reach: MRR.io lacks segmentation and custom dashboards. It also doesn't have dunning; it reports failed charges but can't act on them. No cancellation flows. Forecasting is simple metric projection rather than financial modeling. Support is email-based on the Pro plan.
Where each tool genuinely wins
These are real, and pretending otherwise doesn't help anyone choose.
ChartMogul wins on economics at the bottom and infrastructure at the top. Its free tier runs to $10K MRR with core analytics, segmentation, forecasting, benchmarks, and a CRM seat included. If you're pre-$10K MRR and need core metrics, ChartMogul is the better economic choice and we're not going to argue otherwise. Above that line, the native CRM ships on every plan, the benchmarks are stage- and ARR-specific. ChartMogul also has data warehouse exports to Snowflake, BigQuery, Redshift, S3, and Azure land on Pro and above. If you have a data team and BI tooling, that's a significant consideration for ChartMogul. PayPal and GoCardless are also native integrations for ChartMogul.
MRR.io wins on price at small customer counts, and on restraint. Free up to 100 paying customers is free forever, and for a high-ARPU business with a small book nothing beats that. And if you want one clear chart of MRR and churn and nothing else, more product is not better product.
Baremetrics wins on the layer above the dashboard. Financial forecasting is the clearest case: runway, burn rate, CAC, expense breakdown, budget variance, and scenario planning, fed by QuickBooks or Xero and included free with any paid Metrics plan rather than sold as an add-on. Neither of the others does this at any price. Past that, native failed payment recovery with a customizable email sequence, branded billing widget, in-app banner, and paywall; Cancellation Insights at the moment of cancellation intent; Apple App Store and Google Play alongside Stripe, normalized into one MRR; unlimited segments and dashboards with no cap; and unlimited support calls with hands-on sessions where we build things with you. Launch also starts at $49/month on annual billing, below ChartMogul's Starter at $59/month annual.
Full comparison table
| Capability | Baremetrics | ChartMogul | MRR.io |
| Core SaaS metrics | Full | Full | Solid essentials |
| Cohort retention | Yes | Yes | Yes (Pro) |
| Segmentation | Unlimited | All plans, dashboard count capped by tier | Not offered |
| Custom dashboards | Unlimited | Capped by tier | Not offered |
| SaaS revenue forecasting | Yes | Yes (ARR modeling, all plans) | Simple metric forecasts |
| Financial forecasting (P&L, runway, burn, CAC) | Forecast+, included with any paid plan | No | No |
| QuickBooks / Xero | Native | No | No |
| Failed payment recovery | Recover — add-on; Stripe, Braintree, Recurly | Third-party ecosystem | Reports failures only |
| Cancellation flows | Cancellation Insights | Not confirmed | No |
| Built-in CRM | No (HubSpot integration) | Native, all plans | No |
| Industry benchmarks | General SaaS | Stage- and ARR-specific | No |
| Data warehouse exports | No | Pro and above | No |
| Native sources | Stripe, Braintree, Chargebee, Recurly, Shopify, Apple, Google Play + API/CSV | Stripe, Chargebee, Paddle, Recurly, Braintree, PayPal, GoCardless + more | Stripe, Paddle + API/manual |
| Free tier | No | Up to $10K MRR | Up to 100 paying customers |
| Entry paid price | $49/mo (Launch, annual billing) | $59/mo annual, $69 monthly | $19/mo (250 customers) |
| Pricing basis | ARR band | ARR | Paying customer count |
| Support | Unlimited calls, live chat in minutes | Varies by tier | Email (Pro) |
How to choose
Choose MRR.io if you're under 100 paying customers, you want a clear dashboard and nothing more, and you're on Stripe or Paddle. It's free at that size and it does what it says.
Choose ChartMogul if you're pre-$10K MRR and want a free tier that includes real segmentation and forecasting, or if a native CRM inside your analytics tool is something you'd actually use. Also consider ChartMogul if you need data warehouse exports for a BI stack, or if your billing requires a native integration with PayPal or GoCardless.
Choose Baremetrics if you need to do something about churn and failed payments rather than just watch them, if you want runway and burn alongside MRR without buying a separate finance tool, if your revenue is spread across Stripe plus Apple plus Google Play and you need one number, or if you're in the $10K–$30K MRR range and want the most capability per dollar at that stage.
The honest summary: ChartMogul and Baremetrics are close enough on core metrics that the decision comes down to which direction you need to grow — CRM and benchmarking, or financial forecasting and revenue recovery. MRR.io is competing on a different axis entirely, and at small customer counts it wins on price in a way neither of the other two can match.

