Table of Contents
One thing before comparing: SaaSOptics no longer exists. It merged with Chargify in April 2022 and rebranded as Maxio. If an article still compares "SaaSOptics" as a live product, it's years out of date. This comparison covers Baremetrics vs. ChartMogul vs. Maxio — the decision people are actually making in 2026.
Founders and finance leads land on this comparison because:
- MRR, churn, and cohort questions still get answered with spreadsheet archaeology
- Investors are asking for metrics (GRR, cohort retention, LTV) their current stack can't produce
- Finance wants audit-grade revenue recognition, while operators want daily metrics — and no one tool obviously does both
- Three vendors, three completely different pricing models, zero clarity on fit
The clean way to think about it: Baremetrics and ChartMogul are analytics layers that read your existing billing data. Maxio is a billing and financial-operations platform you migrate onto. That difference drives everything. Cost, setup time, and who each is for.

Metrics questions due this week, not this quarter? Baremetrics connects to your billing in ~30 minutes.
Quick comparison
| Capability | Baremetrics | ChartMogul | Maxio |
|---|---|---|---|
| Category | Analytics + retention layer | Analytics + CRM layer | Billing & fin-ops platform |
| Setup | ~30 min, self-serve | Fast, self-serve | Implementation project |
| Core SaaS metrics | ✅ Real-time from payment data | ✅ | ✅ Audit-grade, from billing/contract data |
| Financial forecasting (P&L, runway, burn) | ✅ Forecast Plus | ❌ | Partial (within billing data + GL) |
| Revenue recognition (ASC 606) | ❌ | ❌ | ✅ Core, audit-ready |
| Recurring billing engine | ❌ (reads your billing) | ❌ | ✅ Core product |
| Failed-payment recovery | ✅ Recover (native) | Third-party ecosystem | ✅ Within billing platform |
| Cancellation insights | ✅ Native widget + win-backs | Not confirmed | ❌ |
| Built-in CRM | HubSpot sync | ✅ Native, every plan | ❌ (CRM integrations) |
| Pricing | ✅ Published, from $49/mo | ✅ Published, free to $10K MRR | ❌ Quote-based, annual |
Baremetrics
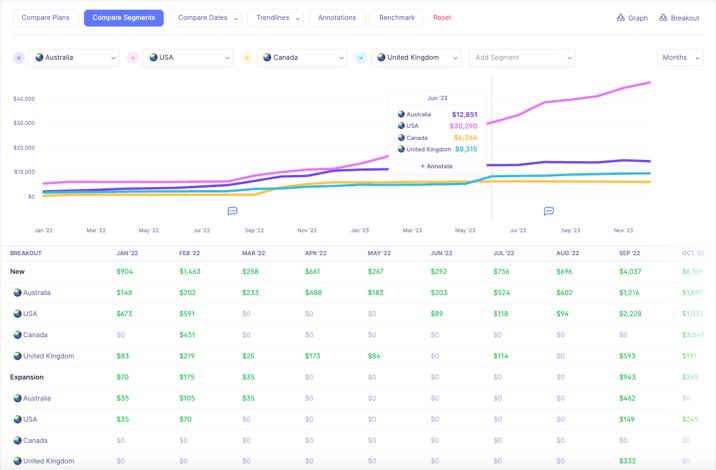
Customer segments by country in Baremetrics
Baremetrics is the analytics and retention layer for subscription businesses. Fast and self-serve. It works with Stripe, Braintree, Chargebee, Recurly, Apple, Google, or Shopify.
Metrics, pre-built. Full MRR waterfall by day, churn (user and revenue), LTV, ARPU, net revenue and fees, at-risk revenue, cohort retention tables, benchmarks, annotations, and a live event stream — with unlimited segmentation and unlimited saved dashboards per segment.
Financial forecasting via Forecast Plus. Connect QuickBooks or Xero and model runway, burn rate, CAC, budget variance, and scenario plans from your actual P&L. This is the bridge between operator metrics and CFO reporting — without migrating billing.
Retention tooling. Recover (up to 7 customizable branded dunning emails, billing widget, paywall, SMS — $1.24M recovered across active accounts in May 2026 alone) and Cancellation Insights (reason capture, win-back emails, and reason-based Retention Offers).
Support. Unlimited onboarding calls, ~2-minute chat, working sessions where the team builds dashboards with you.
ChartMogul
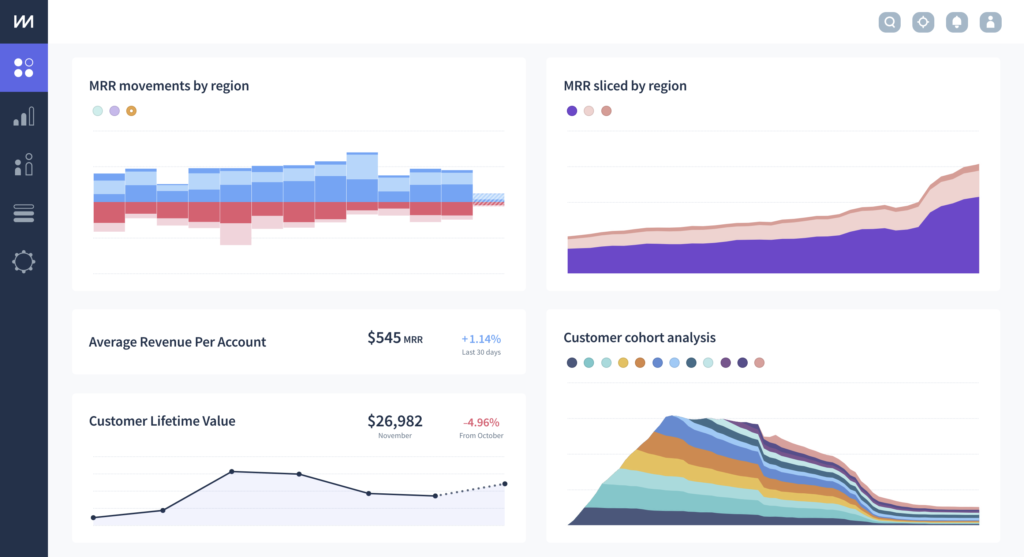
ChartMogul's Dashboard
ChartMogul is the closest analytics peer. It's neck and neck with Baremetrics on core metrics, differentiated by a native CRM on every plan, stage/ARR-specific industry benchmarks, broad billing integrations (including PayPal and GoCardless), and data warehouse exports on Pro+. Free up to $10K MRR; paid from $59/month (annual). Review-flagged weaknesses: metric discrepancies against Stripe requiring manual fixes, and hands-off support at lower tiers.
Maxio (formerly SaaSOptics + Chargify)
![Maxio Dashboard [Product Tour Screenshot]](https://baremetrics.com/hs-fs/hubfs/Maxio%20Dashboard%20%5BProduct%20Tour%20Screenshot%5D.png?width=3418&height=1790&name=Maxio%20Dashboard%20%5BProduct%20Tour%20Screenshot%5D.png)
Maxio's Dashboard
Maxio is a different animal. It's a billing and financial operations platform spanning subscription management, usage-based billing, CPQ, expense recognition, and GAAP/IFRS-compliant ASC 606 revenue recognition. At merger it reported 2,300+ customers and $10B+ ARR under management, and its trajectory (including a partnership with AI-native ERP Rillet) points squarely at the CFO stack. Its metrics are investor- and audit-grade precisely because Maxio is the billing system — but that also means quote-based pricing, annual contracts, and a sales-led implementation project rather than a same-day connection.
What each competitor does better
ChartMogul: the free tier to $10K MRR, the shipped native CRM, industry-specific benchmarks, PayPal/GoCardless support, and warehouse exports. All genuine.
Maxio: if you need a billing engine, complex B2B invoicing, or audit-ready ASC 606 revenue recognition, Maxio is the right category — Baremetrics and ChartMogul don't do rev-rec, and saying otherwise would be selling you the wrong tool.
Pair, don't pick: the two-layer pattern
The "vs." framing hides the most common real-world outcome. Billing platforms and analytics layers solve different jobs, so mature stacks often run both. Finance owns Maxio (or whatever billing system of record) for invoicing and audit-ready rev-rec. Operators run a metrics layer on top for daily MRR movements, segmentation, and retention work. Neither replaces the other. The failure mode is forcing one tool to do both jobs: operators waiting on finance reports, or finance defending numbers from a tool built for dashboards, not audits.
The practical test: if your billing system works and the pain is visibility, add a layer. If the billing system itself is the pain (manual invoicing, rev-rec in spreadsheets, contract terms that don't fit), that's a migration decision. And a much bigger one.
What finance will ask in the demo
Four questions separate the categories fast. Can you show rev-rec schedules an auditor will accept? Only Maxio. Can you show today's MRR movement by plan? The analytics layers, instantly. What happens to our metrics if we switch billing systems? Layers re-sync; a platform migration starts over. And who maintains the metric definitions? With a layer, the vendor does. With spreadsheets, you do.
Pricing compared
- Baremetrics: published, from $49/month scaling with revenue; add-ons — Forecast Plus $49/mo, Recover $129/mo, Cancellation Insights $129/mo; 60-day money-back guarantee
- ChartMogul: free to $10K MRR; Starter from $59/mo annual; Pro from $99/mo annual; Enterprise from $19,900/yr
- Maxio: quote-based, annual contracts typical, implementation included in scope
Verdict
- You need daily operator metrics plus financial visibility (runway, burn, CAC) without touching your billing stack: Baremetrics.
- You want analytics with a built-in sales CRM, or you're under $10K MRR and need free: ChartMogul.
- You're a sales-led B2B SaaS whose core problem is billing operations and audit-grade rev-rec: Maxio — and pair it with whatever operator layer your team prefers.