Table of Contents
QuickBooks Online is the most popular invoicing and accounting platform online today. They have incredible features for automated and manual invoicing, tax preparation, expense tracking, bookkeeping automation, cash flow management, and financial reporting.
We also offer Stripe, the most popular online payment processing gateway. Stripe makes it easy for businesses to process payments securely online, and it’s common for businesses to use Stripe payments for orders made through their websites.
Many businesses actually use both tools. SaaS and subscription businesses, for example, may have easy-purchase options on their site that are processed through Stripe but use QuickBooks Online to invoice enterprise clients and for other accounting purposes.
And we’ve got good news: Baremetrics can integrate with both to help you get a better look at what’s happening with your subscription revenue.

Where Stripe & Quickbooks Reporting May Fall Short for Subscription Businesses
Stripe’s revenue analytics are straightforward, giving many businesses the basic financial information they need. You can see which payments have been processed and your total revenue.
Quickbooks Online provides even more detailed financial analytics, largely thanks to its advanced expense tracking features. They have multiple reports available, including cash flow statements and profit and loss statements.
Neither, however, is dedicated to subscription revenue analytics. Quickbooks Online isn’t designed to focus on metrics like customer or revenue churn, for example, or to help you best track trial conversion rates. Similarly, Stripe’s reporting only focuses on the payments processed through their own system, and it may have issues accurately calculating more complex metrics like MRR.
Using both platforms individually can result in data silos, even when you’re integrating them. And, while both present a solid list of financial metrics, neither provide actionable insights that can be used to improve conversion rates, prevent churn, or increase customer engagement.
You can see the end result of how your sales and customer success campaigns have improved revenue, but neither platform offers detailed metrics showing actions like number product upsells, downgrades, converted trials, and more.
What is Baremetrics?
Baremetrics is a subscription revenue analytics and insights platform.
Here’s what we bring to the table:
- 26 subscription-centered metrics, including MRR, churn rate, upsells, and trial conversion data
- Actionable insights that can help you improve your MRR and retention rates
- Financial forecasting data, including scenario planning options
We integrate with your payment processing and accounting platforms to provide detailed, accurate, and up-to-date revenue data so you can make better, more strategic decisions to maximize revenue.
The 5 Benefits of Baremetrics’ Stripe and Quickbooks Integrations
Baremetrics offers simple, streamlined integrations for both Stripe and Quickbooks Online, and leveraging Baremetrics for subscription analytics offers five distinct benefits.
1. Access All Data in One Dashboard
Many subscription businesses sell in multiple places and may import sales and expense data into QuickBooks Online.
The data you get from Stripe is going to look different from the data you get from, say, the Apple Store or Google Play, because they’ll each have their own sales data and potentially their own methods of calculating or tracking metrics.
And for data engineers, marketers, and product teams just trying to make smart revenue decisions, these data silos are migraine-inducing.
Baremetrics integrations, however, allow you to connect your payment processing, sales, and accounting platforms into one reporting source. View all the data in one dashboard for a holistic look at revenue-impacting metrics and insights.
2. Compare Performance Data From Multiple Revenue Channels
It’s useful to see subscription performance and revenue metrics across the board, but it’s also invaluable to compare performance across multiple revenue channels.
For example, you might discover that customers paying through Stripe on your website are more likely to upgrade later on or retain longer than those who purchase through mobile app stores.
Use this information to optimize your marketing and customer success campaigns to attract more high-value users, increasing revenue overtime.
3. Leverage Data & Reporting Consistency
Data consistency is important. You want to know exactly what you’re looking at and what it means.
And of course, you want it to be accurate.
Many payment processing or even some subscription tools may struggle with this. It’s common, for example, for many platforms tracking MRR to inadvertently inflate the MRR metric by accidentally counting inactive or paused subscriptions towards the total revenue.
At Baremetrics, subscription-focused metrics are our bread and butter. We prioritize data accuracy and consistency and have worked hard to ensure that our metric calculations and reporting reflect your true financial and engagement performance.
4. Take Advantage of Detailed Insights
Baremetrics offers more than singular metrics; we also help analyze these metrics to provide insights that you can act on to better retain customers, make well-informed revenue decisions, or even prevent churn.
Use Baremetrics to access and leverage the following insights for revenue-boosting changes:
- Cancellation insights, which can help you determine why customers are churning and how to prevent it
- Trial insights, which can provide suggestions on steps to take to improve the trial-to-customer conversion rate
- Recover, which leverages automation to help you identify and prevent lost revenue due to missed payments
- People insights and segmentation features to identify high-value audience segments
Use these insights to learn what’s really impacting your revenue performance… and how to improve it.
5. Leverage Financial Forecasting
Baremetrics customers who connect to QuickBooks Online can leverage our financial forecasting and modeling tool, Forecast +. Benefit from accurate scenario planning to forecast your business’s revenue, including best case, baseline, and worst case scenarios, with detailed revenue projections that consider your current revenue performance.
How to Set Up Baremetrics Integrations
Integrating Baremetrics with subscription and financial data sources (including both QuickBooks Online and Stripe!) just requires a few quick clicks each.
When creating your Baremetrics account, we’ll ask you to connect your data sources. Click on the platform of your choice, and you can connect to your third-party account.
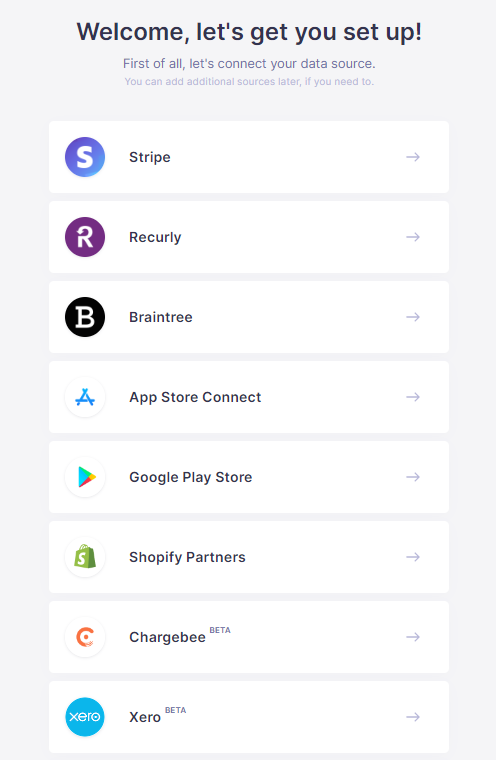
Once you do, data syncing begins immediately. Connect to all your data sources to deliver the most complete reporting for your business.
Final Thoughts
Baremetrics provides consistent, accurate revenue analytics, including 28 crucial metrics for subscription businesses. We can help you track what’s happening so you can trust it when making revenue-impacting decisions, so you make better choices that benefit your brand long-term.
Tired of wasting time on spreadsheets? Get a free trial of Baremetrics today!