Table of Contents

Key takeaways:
- LTV is a commonly prioritized metric for SaaS businesses, but accurately tracking and analyzing it is difficult
- Simple LTV can provide detailed insight into customer value in multiple different scenarios, though you may need to consider a potential margin of error
- Combining statistical data and historical performances with your LTV data can provide subscription businesses with more detailed and accurate insights
Lifetime Value (LTV) is one of the most important metrics we follow in SaaS. It tells us the value our customers bring to our business.
Typically, LTV is estimated using a “simple” LTV calculation. But is it really effective?
In a previous post, we explored pitfalls in using churn metrics. We found that churn calculations misleads us in some circumstances, such as when there are many short-term customers, which may make it difficult to accurately identify users at risk for churn and requires careful assessment of customer vs revenue churn..
Our most popular metric for LTV is a “churn”-based metric, where churn is in the denominator when calculating it. So, what does that say about our LTV calculations? Are they wrong sometimes?
In this post, we’re going to test the “simple” LTV metric.
- When is it accurate?
- Where does it mislead us?
- How close does it get us to the actual LTV?
Calculating Simple LTV
Before we dive in, let’s review what “simple” LTV is. Here is the formula
LTV = Average monthly revenue per user/user churn
Notice that it includes churn in the denominator.
If churn misleads us for customer retention, does it also mislead us for lifetime value calculations?
Let’s run some simulations where we know the actual value for LTV and see how the “simple” method estimates it.
Scenario 1: LTV in a Stagnant Business With Many Short-Term Subscribers
Here we have our first scenario: a stagnant business where nothing changes. Sign-ups stay the same. Dropouts stay the same, and the average lifetime of a subscription does not change. Here’s a summary:
- Average sign-ups per month: 30
- Average subscription lifetime: 2 months
- Subscription price: $20/month
- Average lifetime value: $40
- Many short-term subscribers
The graph below illustrates a simulation where we generate the data ourselves using known parameters (such as sign-up rates and subscription lifetimes). We can evaluate key metrics, such as “simple” LTV, by comparing them against the truth.
Here’s a look at the active subscriber population in the simulation we described above:
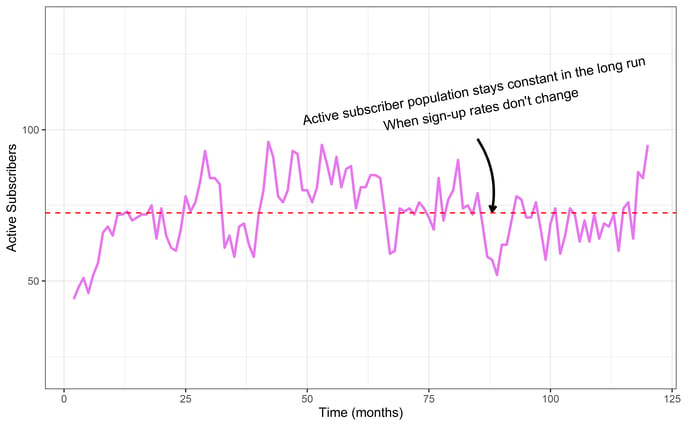
Notice how the population of active subscribers grows quickly over the first 20 months, then the population fluctuates above and below the red dotted line for the following duration of the simulation. After about 15 months, the business is truly stagnant. The purple active subscriber line will forever hug the red dotted line, fluctuating at around 72 subscribers.
An LTV metric should be easy to handle in a stagnant business scenario because nothing changes. The metric should have plenty of data to capture the true LTV. But can our “simple” LTV metric approach the true LTV that we know?
Breaking it Down by Month
Let’s calculate LTV each month in the time series above. We will begin with small amounts of data in the early months, but as our dataset grows, the estimate should get closer to the real LTV value. Does it?
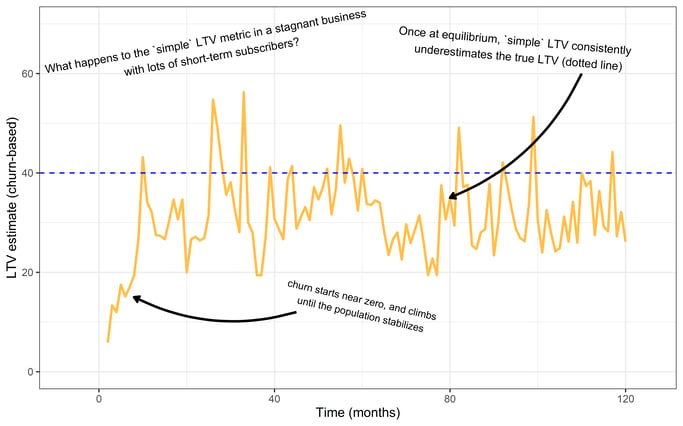
The chart above shows the simple LTV estimate calculated every month. The blue line indicates the actual lifetime value for this customer base. Notice that while the business is in its growth phase, our “simple” LTV underestimates the true LTV by a lot.
Just to recap, we know the LTV in this simulated situation as we have chosen it. We then used the simple LTV metric to calculate LTV. Then, we compared the simple LTV metric and the LTV metric, which is a parameter of the simulation, to see if they were the same or not.
The simple LTV starts near zero. It starts small because the customer population hasn’t stabilized yet, and many short-term customers are dropping out relative to the rest.
The simple LTV is much closer to the real thing when the population stabilizes, but we still tend to underestimate LTV. The average LTV estimate when the population stabilizes is $32. That’s 20% less than the true value of $40. It’s an underestimate, but surprisingly, it isn’t terrible!
The Results
While not perfect, simple LTV calculations in the above scenario seem usable, only about 20% off.
But how does the “simple” LTV calculation fare in a more typical Baremetrics user’s customer base, where customers subscribe for an average of a few years?
Scenario 2: LTV in a Stagnant Business with Long-Term Subscribers
What if we tried the simulation with a different customer base? Would we still get underestimates? Let’s try a new simulation with fewer short-term subscribers. Would our LTV estimate be any better once churn is reduced? (Keep in mind: Churn is inevitable, even though many brands strive for negative churn.)
The graph below represents a different simulation. The parameters are the same as before, except for a different distribution of subscribers. This population closely resembles an actual Baremetrics customer.
In this simulation, there are fewer short-term subscribers, and the average subscription lifetime is 3.7 years. If the average subscription lasts for 3.7 years, then the actual LTV is $904.
This is calculated by spending 3.7 years x 12 months x $20 monthly.
Can “simple” LTV get close to that $904 number?
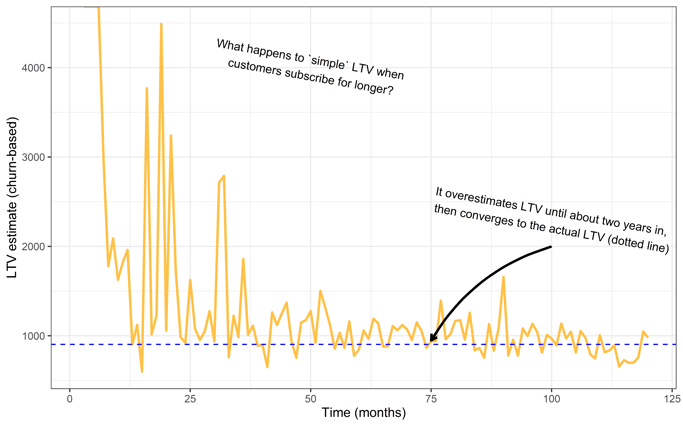
In the above chart, the yellow line represents the simple LTV calculation calculated each month as the simulation progresses. Notice that we get dramatic overestimates at the beginning. Why is this? It’s because we have more longer-term subscribers. Very few customers are dropping out in the early months of this process. As a result, our estimate for LTV is much too high because our estimates expect the subscriptions to last forever with such a low drop-out rate.
The customer population stabilizes after 3.7 years, however. After 3.7 years, we get estimates close to the actual LTV (blue line). What’s more, it appears to be a much more accurate estimate than in our previous scenario. It’s off by only a few percentage points!
The Results
So, as a verdict, “simple” LTV is not so bad when customers stay long-term, and nothing fundamentally changes in the business! Especially considering the issues we discussed in our previous post about churn.
So, can we find a scenario where “simple” LTV fails? Maybe “simple” LTV fails when the customer population rapidly changes. Perhaps we see the same problem here because our simple LTV estimate wildly overestimates the lifetime value for the first two years.
Scenario 3: LTV in a Growing Business
Let’s try another simulation to explore this issue further. Let’s keep everything the same as the scenario we did above, but with one key.
Suppose we have a great marketing team that steadily increases the number of monthly sign-ups, and our average sign-up rate goes up by one percent each month.
After 100 months, we should be getting double the number of customers on average each day. The lifetime value, however, doesn’t change. Does this extreme growth ruin our LTV estimate?
Here is a chart of the active customer base:
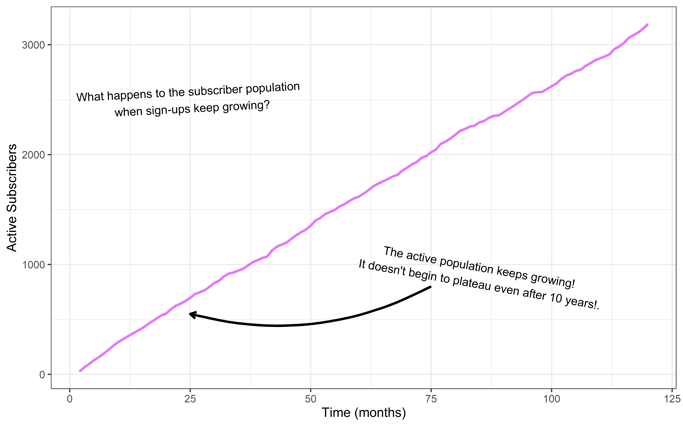
As we get increasing sign-ups, our active customer population rockets upward.
Amazing! How does our LTV calculation fare?
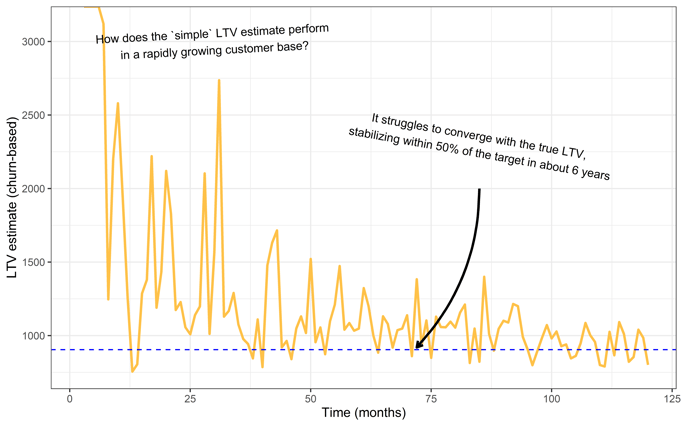
See the chart below:
The Results
In the above chart, we see how “simple” LTV estimates (yellow) take longer to converge with the true value for LTV (dotted line).
The estimates do eventually converge with the true value, but only after about ten years. Even five years into this time series, our LTV estimates are off by as much as 50%.
It appears the “simple” LTV estimate is sensitive to a changing customer population, even though the customer population size should have nothing to do with the individual's lifetime value.
This sensitivity to population size is because the simple LTV estimate depends on churn, which is sensitive to a rapidly changing population size.
Let’s Try a Different Metric For LTV
Can we find a better metric for LTV? One that doesn’t get distorted by changing sign-up rates? Instead of the simple LTV estimate, let’s build one based on statistics.
In this example, let's estimate a customer's average lifetime using a statistical model. Using our data, we’ll build a statistical model for subscription durations.
We’ll use Weibull regression as our statistical model. We feed data into the model, and it will produce an estimate for the average subscription lifetime.
Then, we multiply the average subscription lifetime by our monthly rate of $20/month to obtain an LTV estimate. How would such an estimate compare with “simple” LTV?
Let’s repeat the previous simulation with growing customer sign-up rates and calculate the LTV both ways to compare.
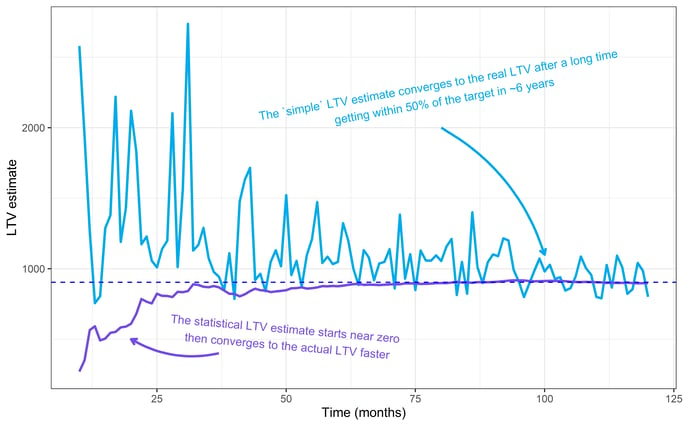
In the plot above, we show LTV estimates over time. The “simple” LTV estimate is blue, and the statistical estimate is purple.
Notice how the statistical method converges with the true LTV value (dotted line) long before the “simple” estimate. With the statistical estimate, we get within a few percentage points of the actual LTV with about 18 months of data, long before the customer base reaches a stable population.
In contrast, the churn-based estimate takes ten years to catch up and never reaches the same level of accuracy. The statistical estimate outperforms the simple churn-based one.
Statistics Beats “Simple” LTV, But Can We Do Better?
An interesting side-note: Notice how, at the beginning of the above chart, the churn-based estimate overestimates the actual LTV, whereas the statistical method underestimates it. Why? Both of these distortions happen because these estimates are naive. They don’t know anything before seeing data, so they begin with absurd estimates: the statistical estimate starts at zero, and “simple” churn starts near infinity.
So, can we improve our estimates by giving them a better starting point before they see any data?
Good news: Yes.
It turns out we can improve our statistical estimate by giving the model some education. If the model starts with a vague idea of what an average subscription lifetime looks like, based on previous experiences or experiences of peers. Let’s say we expect a subscription lifetime to last about a year. A wide ball-park guess, but more realistic than zero. Then as the data rolls in, we update our estimates.
As we collect more data, our vague starting point will steadily disappear, giving way to whatever the data tells us. But initially, it will help by starting closer to the truth.
What we are doing is called regularization in statistics and machine learning. It’s a technique where we add bias to our model–the good kind of bias. It puts more weight on realistic data points and treats extreme observations with skepticism. We get better estimates as a result.
Below, we’ve added a new, improved estimate that uses regularization. It’s similar to the statistical estimate, but it makes use of something called a Bayesian prior. A prior is like a vague pre-conception. It nudges our estimates towards what we know to be reasonable subscription lifetimes, so our estimates start closer to the real thing. Let’s see how it does: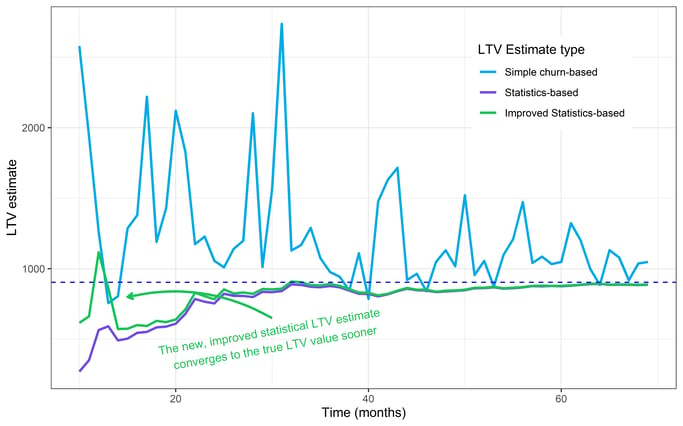
We’ve added an improved statistical estimate (green) in the above chart. Notice how the new estimate outperforms the others in the first few months. This improvement does exactly what we intended.
Our improved estimate is closer to the real LTV value in the early months. As the data rolls in, however, the two statistical estimates converge, eventually becoming indistinguishable.
Using Baremetrics to Accurately Track Key Performance Metrics
Hopefully, we have shown that it is possible to find better LTV metrics than churn-based ones. Churn-based LTV estimates can be highly inaccurate, especially when there is little data. We can replace it with these better metrics. Further, we can also fine-tune them, so they are better suited for our field in SaaS.
Baremetrics provides accurate, up-to-date data for 26 performance and financial metrics that are critical for SaaS businesses, including gross vs net churn, monthly recurring revenue, and of course LTV. If you want to reduce SaaS churn— or even analyze churn to better understand why customers aren’t retaining—, Baremetrics can help.
We also have advanced customer segmentation features, Cancellation Insights to provide insight into customer cancellation, and Recover to prevent involuntary churn with dunning management.
Tired of wasting time on spreadsheets? Get a free trial of Baremetrics today!


