Table of Contents
Customer lifetime value (LTV) is the total revenue you can expect from a customer before they churn. For a subscription business, the customer lifetime value formula is average revenue per user (ARPU) divided by your user churn rate:
LTV = ARPU ÷ user churn rate
For example, with an ARPU of $100 a month and a monthly user churn rate of 5%, LTV = $100 ÷ 0.05 = $2,000. Run your own numbers in the free LTV calculator.
Of all the metrics you need to track as a SaaS company, lifetime value (LTV) may be the most mysterious. It feels difficult to calculate, and once you have the calculation, you don’t know what to do with it, whether good or bad.
Last updated: November 2026
Hopefully, today, we can demystify the metric and offer some insight to help you use it better within your company!
Table of contents:
- What is lifetime value?
- How to calculate LTV (formula and example)
- Simple vs margin-adjusted LTV
- Churn variance and sample size
- CAC and LTV
- Typical LTV by ARPU
- LTV and churn
- How to increase LTV
- LTV FAQ
Key takeaways
- LTV = ARPU ÷ user churn rate. At $100 ARPU and 5% monthly user churn, LTV is $2,000.
- Average customer lifetime = 1 ÷ user churn rate, so 5% monthly churn means about 20 months.
- Margin-adjusted LTV multiplies ARPU by gross margin first. Baremetrics and its LTV calculator use the simple formula, with no margin adjustment.
- For a more conservative estimate, multiply LTV by a discount rate of about 0.75.
- Typical LTV on Baremetrics Open Benchmarks ranged from $107 (under $10 ARPU) to $9,296 ($250 and up) on October 14, 2026. These describe the sample, not targets.
- Compare LTV with customer acquisition cost (CAC). A common rule of thumb is an LTV:CAC ratio above 3.
What is customer lifetime value?
Customer lifetime value (CLTV) is the predicted revenue a customer generates over the entire relationship with the company, or "customer lifetime". This metric is useful for making predictions and long-term plans, as you'll want to balance CLTV with other factors like customer acquisition cost.
This way, the CLTV metric can help you move from transaction-based thinking to focusing on the long-term value of repeat business.
Say you charge $100/mo for your service, and a customer stays with you for 12 months. Their LTV would be $100 × 12 = $1,200.

How to calculate customer lifetime value (LTV formula)
The example above is how you calculate LTV for a single customer. But that obviously isn’t practical for running your business (since you hopefully have more than one customer).
To measure LTV, we’ll need two additional metrics:
1. Churn rate: This is the number of subscribers who unsubscribe or stop paying over a given period of time.
Example: If you had 100 subscribers at the start of the month and 5 cancelled during it, your monthly user churn rate is 5%.
2. Average Revenue Per User (ARPU): This is the average revenue of all your current accounts. Or MRR/total users.
Example: If you have 100 accounts and make $50 a month from 50 of them and $100 a month from the other 50, then your ARPU is $75 a month.
Now, let’s look at how to calculate the lifetime value of a customer.
LTV = ARPU (average monthly recurring revenue per user) × Customer Lifetime
You can also calculate lifetime value using churn (which is a number you likely have more readily available).
LTV = ARPU / User Churn
The higher your user churn, the lower your lifetime value will be. This is why paying attention to both LTV and churn is so critical.
The two formulas give the same answer, because average customer lifetime in months is 1 ÷ user churn rate. Use monthly figures for both inputs, and enter churn as a decimal, so 5% is 0.05.
Worked example: calculating LTV step by step
| Step | Formula | Example |
|---|---|---|
| 1. ARPU | MRR ÷ active customers | $100 a month |
| 2. Monthly user churn rate | Customers cancelled in the last 30 days ÷ active customers 30 days ago | 5% (0.05) |
| 3. Average customer lifetime | 1 ÷ user churn rate | 20 months |
| 4. LTV (simple) | ARPU ÷ user churn rate | $2,000 |
| 5. Conservative LTV | LTV × 0.75 discount rate | $1,500 |
| 6. Margin-adjusted LTV | (ARPU × gross margin) ÷ user churn rate, at an 80% gross margin | $1,600 |
Luckily, you don’t have to calculate customer lifetime value manually. Using Baremetrics, you can automatically track and analyze your LTV growth over time!
Get a 14-day free trial of Baremetrics now and calculate your LTV automatically.
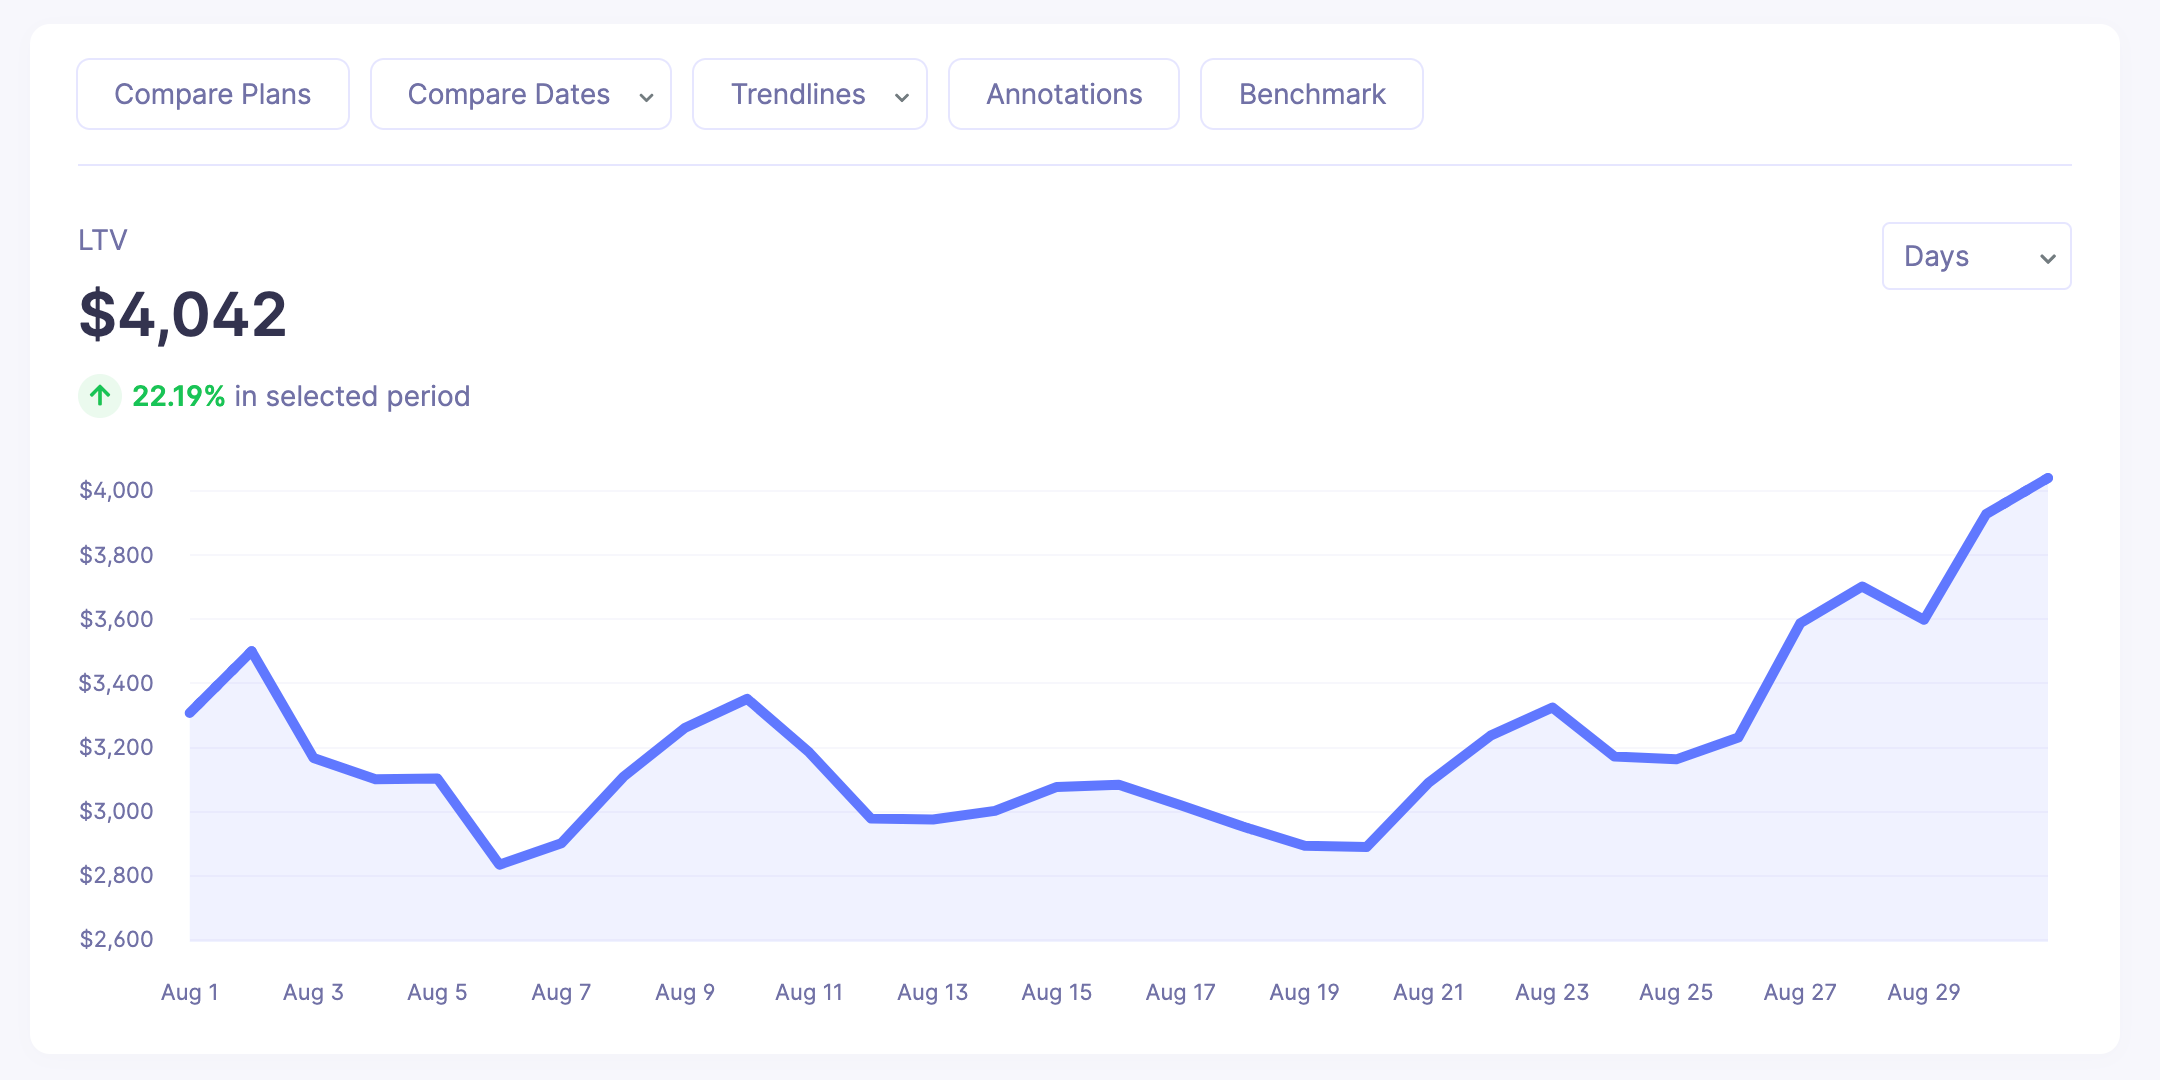 LTV inside Baremetrics
How Baremetrics calculates LTV
Baremetrics calculates lifetime value as average monthly recurring revenue per customer ÷ user churn rate, the ARPU ÷ user churn formula above. Both inputs come straight from your billing data: ARPU is MRR ÷ active customers, and user churn is cancelled customers in the last 30 days ÷ active customers 30 days ago. That leaves two levers: raise ARPU through pricing or plan mix, or lower user churn. In the Baremetrics dashboard you can add trend lines, goals and annotations to the LTV chart, and Benchmarks compares your LTV with businesses that have a similar ARPU.
Customers who are delinquent for more than 30 days are treated as cancelled, and only paying subscribers count as active customers. The dashboard LTV is the simple formula: it does not adjust for gross margin, so apply your own margin if you need a profit-based figure.
Source: Baremetrics Help Center (LTV: Lifetime Value, ARPU: Average Revenue Per User, User and Revenue Churn, Benchmarks, Cancellations and Downgrades).
Simple vs margin-adjusted LTV: which formula should you use?
The simple LTV formula (ARPU ÷ user churn rate) measures revenue. Margin-adjusted LTV measures gross profit: it multiplies ARPU by your gross margin before dividing by churn, so it shows what each customer contributes after the cost of delivering the service.
Margin-adjusted LTV = (ARPU × gross margin %) ÷ user churn rate
| Simple LTV | Margin-adjusted LTV | |
|---|---|---|
| Formula | ARPU ÷ user churn rate | (ARPU × gross margin) ÷ user churn rate |
| Measures | Revenue per customer lifetime | Gross profit per customer lifetime |
| Example ($100 ARPU, 5% churn, 80% margin) | $2,000 | $1,600 |
| Used by | The Baremetrics LTV chart, Benchmarks and the LTV calculator | Unit-economics models and LTV:CAC analysis where cost of service matters |
Use one formula consistently. If you compare your LTV with Baremetrics figures or benchmarks, use the simple version; if you are judging how much you can afford to spend on acquisition, the margin-adjusted version is the more cautious one. For spreadsheet versions, including revenue-churn, discounted and margin-adjusted models, see LTV models and Lifetime Value (LTV).
How Do Churn Variance and Sample Size Affect LTV?
Quite often, churn can be messy. For example, if you think about any given cohort — which refers to a group of users that subscribed in a given period – i.e., all subscribers gained in July), there’s often a “cliff,” right after the first month of that cohort’s start date.
We can multiply our results by a discount rate to keep this churn variance accounted for. A discount rate refers to the factor used to account for cash flow losses that may occur in the future.
Use a discount rate of .75 to find a more conservative estimate:
Conservative LTV = (ARPU ÷ user churn rate) × 0.75
For example, an LTV of $1,200 × 0.75 = $900.
Sample size is also important; unfortunately, the scientific method often falls by the wayside in business.
If you have few users or count too few users in your metric calculations, your data may not be scientifically valid.
How Does Customer Acquisition Cost (CAC) Relate to LTV?
The lifetime value calculation is important for your SaaS business because it determines your spending to acquire new customers. Customer acquisition cost (CAC) is defined as the total cost of acquiring a new customer, including marketing and sales expenses. If your CAC is $100 and that same customer has an LTV of $500, you’re basically printing $400.
Can you say “money machine”?!?!?!
The higher your LTV and the lower your CAC, the faster you can grow your business.
If you know how much a customer’s value will be over the course of a lifetime, then you can make smarter decisions about what to spend to acquire a customer.
A good rule of thumb is that if LTV/CAC isn’t above 3, you’re spending too much on acquisition.

What is a typical LTV? LTV benchmarks by ARPU
Typical LTV depends mostly on what you charge. On Baremetrics Open Benchmarks, which groups companies by ARPU, LTV ranged from $107 for companies under $10 ARPU to $9,296 for companies at $250 and up on October 14, 2026. These are typical values for the companies in that data set on that date, not targets.
| ARPU cohort | Lifetime value | Monthly user churn |
|---|---|---|
| Under $10 | $107 | 6.2% |
| $10–$25 | $256 | 5.8% |
| $25–$50 | $417 | 8.3% |
| $50–$100 | $885 | 8.4% |
| $100–$250 | $2,143 | 7.4% |
| $250 and up | $9,296 | 6.1% |
How to read it: LTV rises with every step up in ARPU, while monthly user churn stays between 5.8% and 8.4% in every cohort. So most of the gap between cohorts comes from ARPU, not churn. Baremetrics calculates LTV as ARPU ÷ user churn with no gross-margin adjustment, so compare these figures with your simple LTV, and compare yourself with your own ARPU cohort rather than the overall range.
For the full cohort table, including revenue churn and growth, see SaaS financial benchmarks by ARPU or the live Open Benchmarks.
How Does Churn Impact Lifetime Value?
Within your own business, LTV will often differ a lot from plan to plan because of one nasty word: churn.
Generally speaking, users on your lowest-priced plans will also have the highest churn, making it your most dismal LTV compared to the other plans.
Remember what we said earlier? LTV drives what you can spend to acquire customers. If the average customer takes $200 to acquire, it makes no sense to spend that to acquire a customer with an LTV of $100.
Knowing what your LTV is for each customer segment is critical.
Baremetrics (SaaS analytics & insights) offers this right out of the box, available as soon as you connect your account.
Stop wasting time on countless spreadsheets. Get a 14-day free trial of Baremetrics now.
How to increase customer lifetime value
Knowing your average customer lifetime value is nice, but just looking at a number on a graph will not help you grow your business.
Unless you do something with the KPIs you track, they’re pointless.
So, next, let's discuss how to use lifetime value analysis (it’s easier than it sounds) and other tactics to improve your LTV.
Interview your customers with the highest lifetime value
When you aim to improve your customer's lifetime value, speaking to your existing customers is a good place to start.
For this first tactic, you’ll identify customers with a higher lifetime value than your average and learn more about them.
Specifically, you want to learn:
- Where they get the most value from your product
- How they use your product
- What initially drew them to you (and how they found out about you)
- How they’ve grown with your product since the time they signed up
- Any other insights that’ll help you understand what’s keeping them around
Step one is to find out what your current average LTV is.
Here's ours from our Metrics dashboard: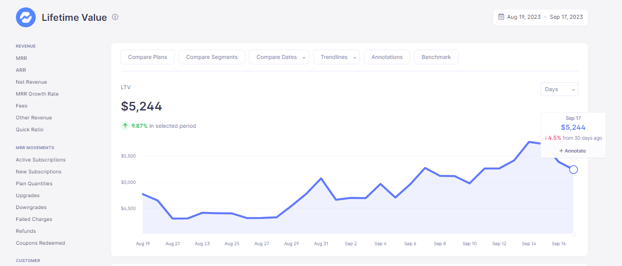
Then, head over to your customer list. We’ll need to set a couple of filters:
- Active customer: Ideally, you want to speak to active customers. Reaching out to people who canceled could be awkward.
- LTV: Filter to only show customers with an LTV higher than the average you found (in our case, higher than $5,244).
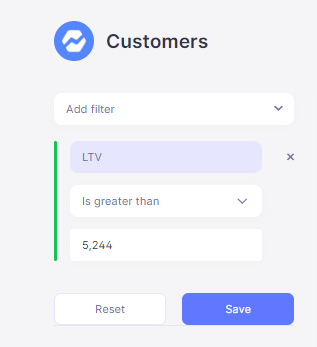
Now, you should have a list of your highest LTV customers.
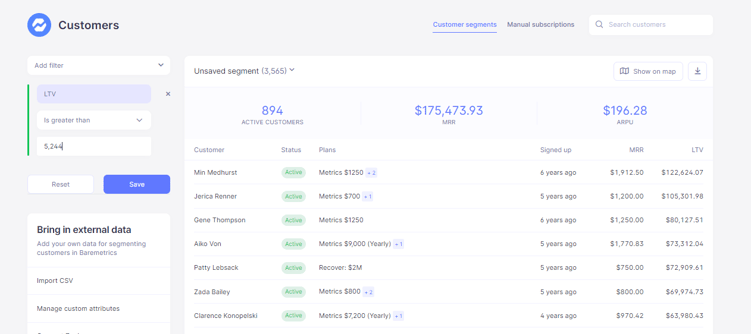
From here, you can ask them if they’d be open to doing a short interview to learn more about how they use the product and get feedback.
Here’s an example of what your email might look like:
|
Subject: {first name}, {your company} handpicked you! Hi {first name}, Thanks for being a long-time {your company} customer! I’m trying to learn more about how our customers use {your product} and since you’ve been such an amazing customer, I was wondering if you’d be interested in helping? Could you spare 15 minutes for a quick call to answer a few questions? We’ll take 10% off your next bill in exchange for your time. You can grab a time on my calendar here {link}. Hope to hear from you soon! {signature} |
You don’t have to give 10% off, or any discount. But if you can offer them something in exchange for doing the interview, you’ll get more people to opt in.
Also, always include a link to schedule a time for the call with something like Calendly or Doodle. That way, it’s super simple for them to set it up.
Then, start gathering the feedback and organizing it in a spreadsheet. Look for trends you can use to improve the LTV of your other customers.
For instance, if you notice most of these customers come from a specific channel (SEO, Google Ads, email, etc.), then you know to invest more in those channels.
Or maybe most of them use a specific feature of your product. You can start marketing that feature more since customers get the most value from it. The interviews can be a huge helping hand in how you develop and market your product going forward.
Compare lifetime value by customer segment
You’re probably starting to notice a trend here. Looking at your LTV as a single number is nice, giving you a 10,000-foot view. But to make it more actionable, you need to break it down into smaller groups so you can identify trends.
Because all customers are not created equal.
You need to know what the LTV is of each major customer segment. For SaaS companies, that’s usually the various price points you offer.
Joe's LTV on your $30/mo plan will almost certainly be a fraction of Sally's LTV on your $200/mo plan—and not just because $200 is more than $30.
You can see your LTV by plan level in Baremetrics.
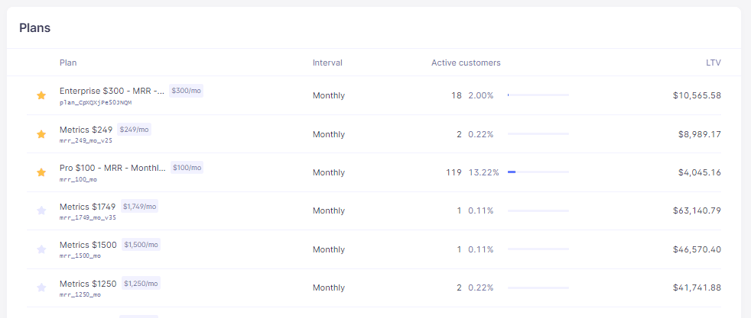 Baremetrics Dashboard view of LTV by plan
As you can see here, there’s a pretty obvious trend. Despite having the most customers, our lowest plans have significantly less LTV.
This is pretty common for SaaS companies. Customers on lower-priced plans tend to churn more and pay less. Customers on our higher-priced plans tend to stick around longer and generate more revenue for us.
Using that data, it’s clear that it’s worth our time to figure out how to get mid-large customers.
Pricing plans are only one way to segment your customers though. In Baremetrics, you can create segments based on location, acquisition source, when they signed up and tons of other criteria.
For instance, we can compare the LTV of our US and Canadian customers.
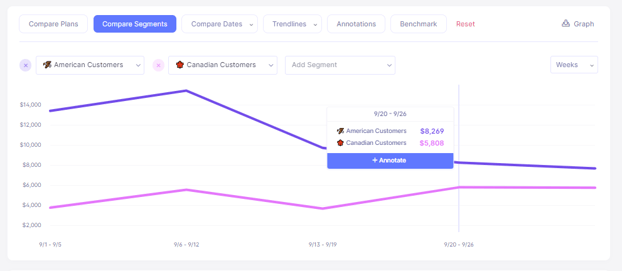 Segmentation of LTV by Customer GEO
As you can probably tell, you can get nerdy here and slice the data in many different ways.
However, the focus should be on identifying which segments have the highest LTV so that more customers like them can be acquired.
Reduce your overall churn
If you look back at the customer lifetime value formula, you’ll notice it’s a function of two things:
- How much money customers spend with you
- How long they remain customers
So, the longer you can keep your customers paying you, the better your chances of increasing your average customer lifetime value.
For this, we need to look at user churn time. How long do customers stay with you before they cancel?
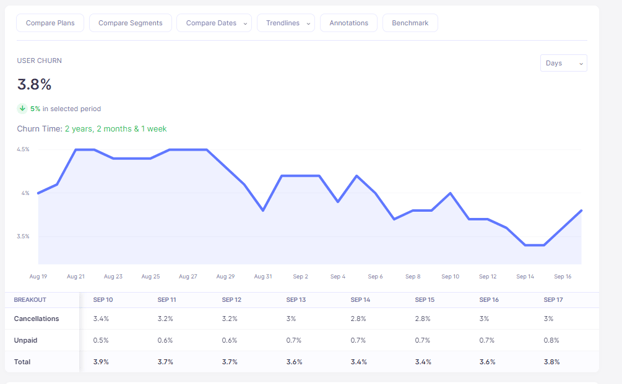 User Churn metric inside Baremetrics
The first thing to note is whether or not your customer churn is high. If you use Baremetrics, a good way to tell how your churn time compares to similar companies is through our Benchmark.
Benchmarks will show you how your metrics compare to companies with a similar average revenue per user (ARPU) as you.
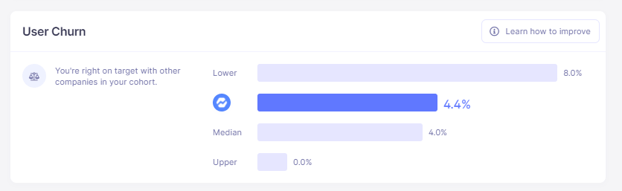 User Churn Benchmark inside Baremetrics
Take note of where you fall in both the user churn and customer lifetime value benchmarks. If you’re in the lower quartile for both, then there’s a good chance your churn rate is probably a problem.
Luckily, we’ve written a ton of articles about how to reduce churn and improve your retention rate:
- 6 Proven Strategies to Reduce Churn (With Real Examples)
- Three-Step Guide to Analyzing Customer Churn
- Customer Churn: How to Calculate & Reduce It
- 5 Ways to Prevent Involuntary Churn in SaaS
- What is Negative Churn? (And How to Achieve it)
- How to Use Cohort Analysis to Reduce Churn & Improve Retention
Between all those resources, you should be well on your way to lowering your customer churn in no time!
Increase your ARPU
Now, let’s talk about the second part of the lifetime value equation—revenue per user.
Since churn is inevitable, you don’t want to rely solely on reducing that percentage. You also need to figure out how to get more revenue per customer. Like you saw in the example I gave earlier, customers who pay less tend to have a lower LTV than higher paying customers.
Keeping things simple, the two main ways to increase ARPU are:
- Raising your prices
- Expansion revenue
I know raising prices is a touchy subject for a lot of founders. But the reality is pricing your product too low is a good way to stunt your growth.
You’ll have to do a good amount of testing before you make any dramatic changes to your SaaS pricing, but it’s something worth looking into if your growth has been at a standstill for a while, and your LTV isn’t growing.
The second tactic is a little less scary. Expansion revenue refers to additional revenue earned from existing customers through upgrades, cross-sells, and add-ons. Customer expansion is all about increasing the revenue you earn from existing customers through:
- Upgrading them to higher priced plans
- Cross-selling complementary products
- Offering add-ons to improve their current subscription
If you’re interested in learning more (and I highly suggest you do), I wrote an entire guide about customer expansion: How to Use Customer Expansion to Skyrocket Growth
Set a customer lifetime value goal
I saved this one for last because if I had put it first you probably would’ve scrolled right past it! But stick with me for a second.
If you’re a person who likes to work towards something actively, setting goals can be very motivational. Goals force you to create a strategy to achieve them. So, just by setting a goal, you’re planting the seeds to take action.
You can set a goal right inside of Baremetrics.
When you set goals, make sure there’s some logic behind them rather than just picking arbitrary numbers.
A good way to do this is to look at your historical numbers. For instance, here’s a look at our LTV over the past 24 months compared to today.
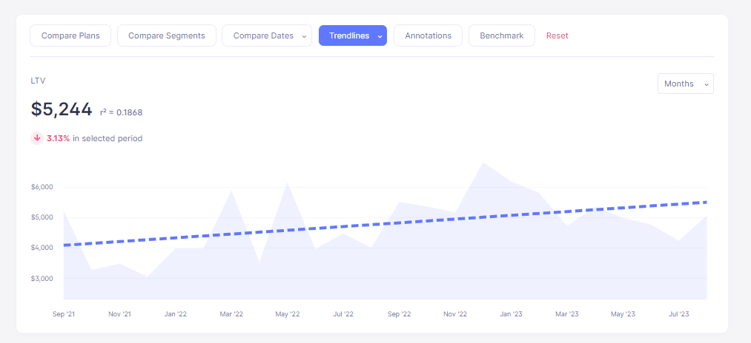
Comparison Trendline inside Baremetrics
We can see that it’s fallen by 25% in 12 months, and all the changes have generally been within 20% over the past 24 months. So, setting a goal to increase it by 50% in the next two months probably wouldn’t be very reasonable.
However, a goal to get it up 10% each month would be more in line with what’s possible.
Related metrics: LTV calculator · customer acquisition cost (CAC) · ARPU · churn rate · MRR · LTV models · all SaaS metric formulas
Track this automatically
See your real LTV — connect Stripe in one click
Skip the spreadsheet. Baremetrics calculates MRR, churn, LTV and dozens of other subscription metrics straight from your billing data, and keeps them up to date.
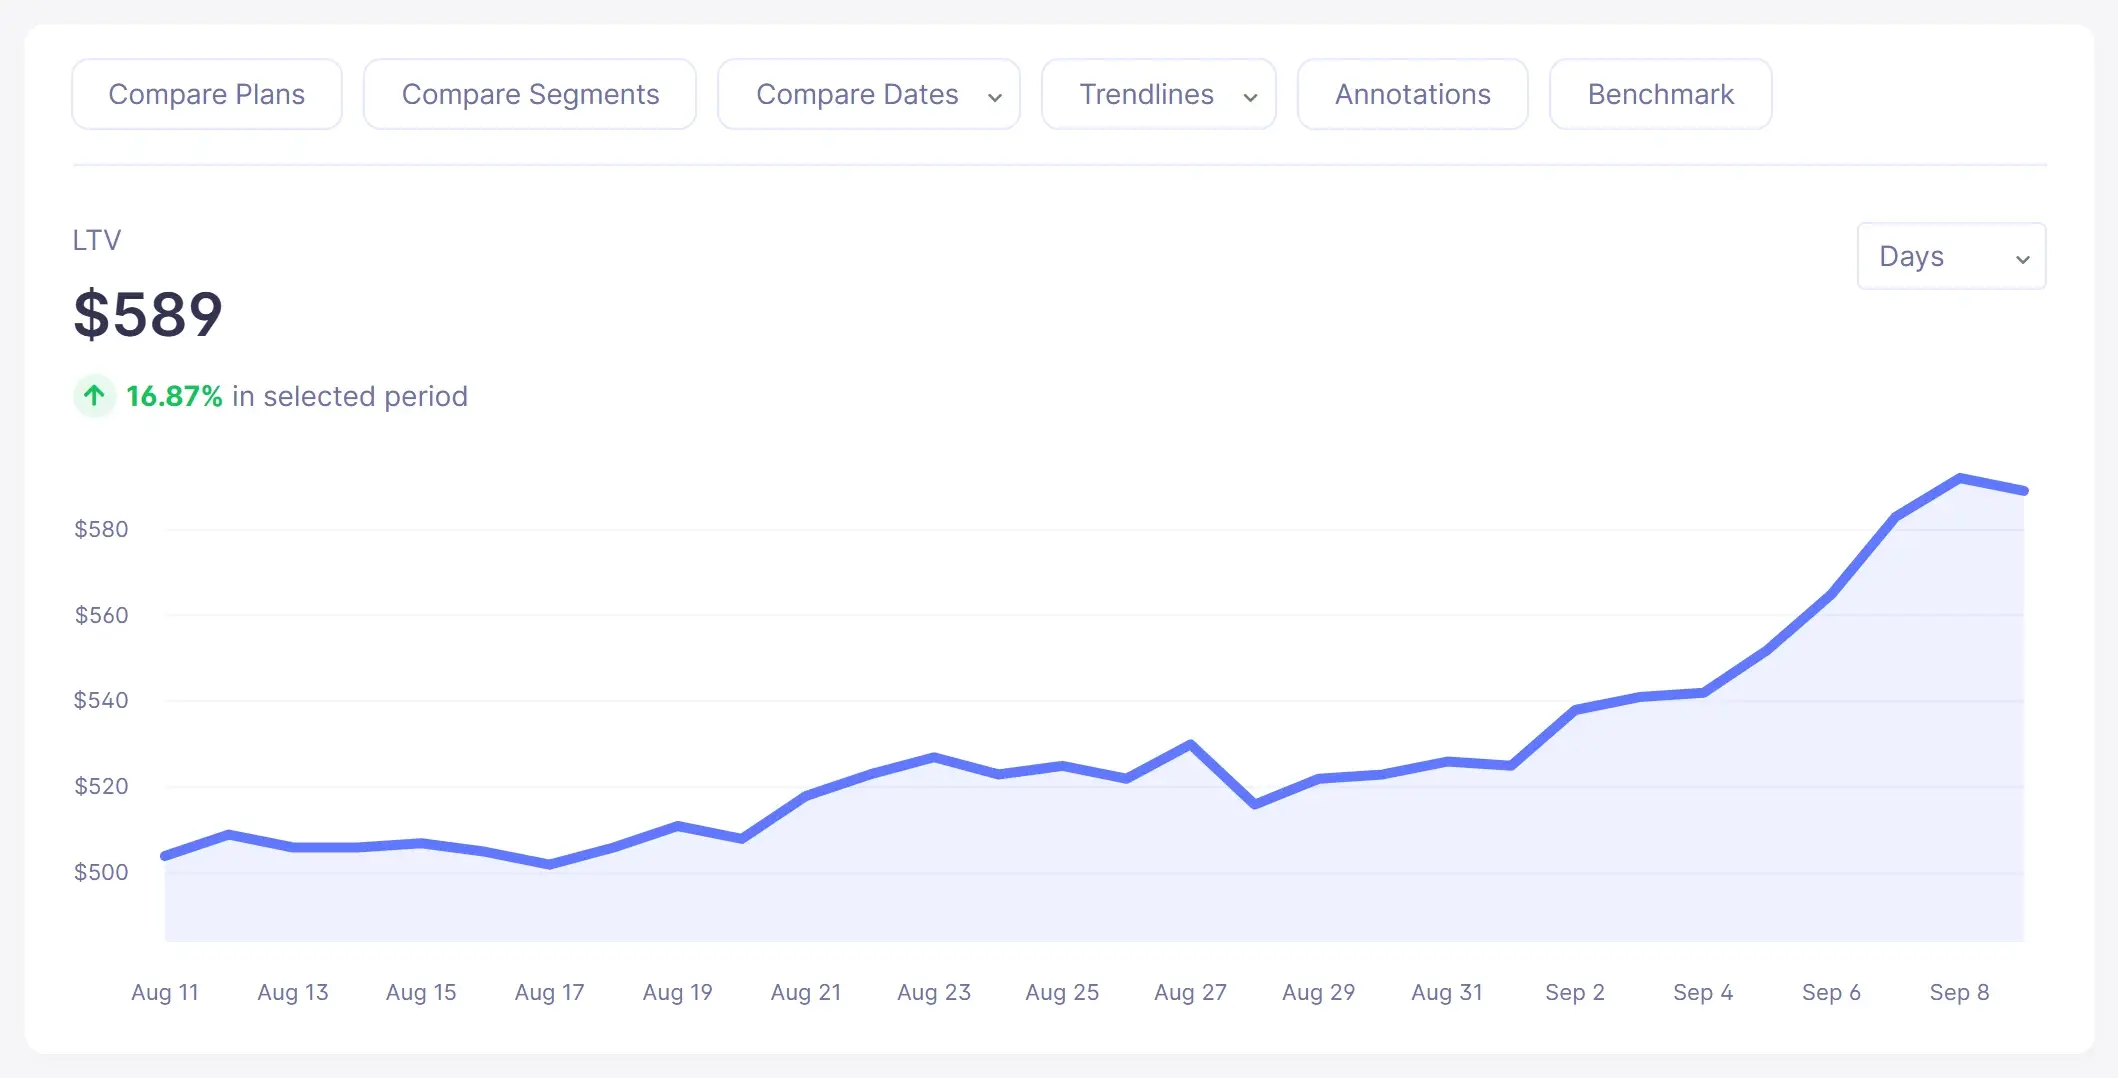
Start your free trial →or explore the live demo
Screenshot shows sample demo data.
Frequently asked questions about LTV
What is customer lifetime value (LTV)?
Customer lifetime value (LTV) is a prediction of how much revenue you can expect from a customer before they churn. For subscription businesses, how long a customer stays matters as much as what they pay each month. LTV also sets the ceiling for how much you can sensibly spend to acquire a new customer.
What is the LTV formula?
LTV = ARPU ÷ user churn rate. Calculate ARPU as MRR ÷ active customers, then divide it by your monthly user churn rate as a decimal. With an ARPU of $100 and 5% monthly churn, LTV is $2,000. For a more conservative estimate, multiply by a discount rate of about 0.75, which gives $1,500.
What is margin-adjusted LTV?
Margin-adjusted LTV multiplies ARPU by your gross margin before dividing by user churn: (ARPU × gross margin) ÷ user churn rate. At $100 ARPU, an 80% gross margin and 5% monthly churn, it comes to $1,600 instead of $2,000. It shows gross profit per customer rather than revenue.
How does Baremetrics calculate LTV?
Baremetrics calculates LTV as average monthly recurring revenue per customer ÷ user churn rate, both taken from your billing data. User churn is cancelled customers in the last 30 days ÷ active customers 30 days ago, and customers delinquent for more than 30 days count as cancelled. It does not adjust for gross margin, and the free LTV calculator uses the same formula.
What is a typical LTV for a SaaS company?
It depends mostly on ARPU. On Baremetrics Open Benchmarks, LTV ranged from $107 for companies under $10 ARPU to $9,296 for companies at $250 and up on October 14, 2026. Those are typical values for that data set on that date, not targets, so compare yourself with your own ARPU cohort.
What is a good LTV to CAC ratio?
LTV shows how much revenue a customer brings in over their lifetime, and customer acquisition cost (CAC) shows what it cost to win them. A commonly cited rule of thumb is that LTV should be at least three times CAC; below that, you are probably spending too much on acquisition. Compare the ratio by customer segment, because LTV varies a lot between pricing tiers.
How does churn rate affect customer lifetime value?
Churn has an inverse effect on LTV: the higher your churn, the lower your lifetime value. Because churn is the denominator in the LTV formula, halving your monthly user churn rate doubles LTV. Lower-priced plans often churn faster and pay less, so their LTV is usually a fraction of your higher plans.
How do you calculate LTV with a small customer base?
Use the same ARPU ÷ user churn formula, but treat the result as a directional estimate. With few customers, a handful of cancellations moves your churn rate a lot, and early cohorts often see a cliff in cancellations right after the first month. Include as many of your customers as possible and apply the 0.75 discount rate for a more conservative figure.
How can SaaS companies increase customer lifetime value?
LTV has two levers: raise ARPU through pricing, upgrades and add-ons, or lower user churn so customers stay longer. A practical start is to find your customers with above-average LTV, interview them about how they use the product and how they found you, and segment LTV by plan, location or acquisition source to see which customers are worth acquiring more of.
What’s your customer lifetime value?
Lifetime value is more than just another SaaS metric. It says a lot about how your product is priced and how much value customers get from your product.
It’s important to not only track it, but also analyze it so you can improve it.
If you have no idea what your company’s LTV is, or you don’t have a tool that allows you to do the level of analysis I went over, don't worry.
Ditch the spreadsheets and get a free trial of Baremetrics to get started.